Results at 2.25 MHz
The figure below presents experimental and simulated echodynamic curves from the backwall only obtained with the KIRCHHOFF and the SPECULAR models. The 3 zones with the smallest amplitude correspond to the shadowing due to the 40, 60 and 80 mm deep ribbons.
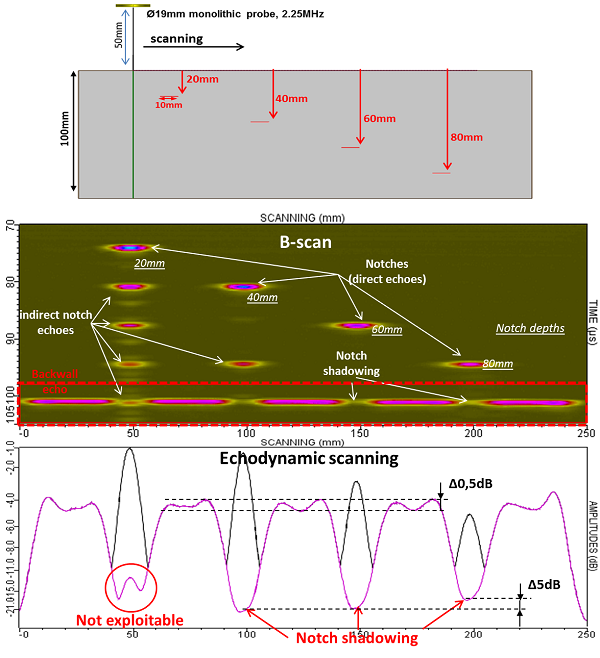
The shadowing due to the ribbon at 20mm depth cannot be measured because the time of flight of the 5th repetition echo corresponds to the time of flight of the backwall echo (see figures below).
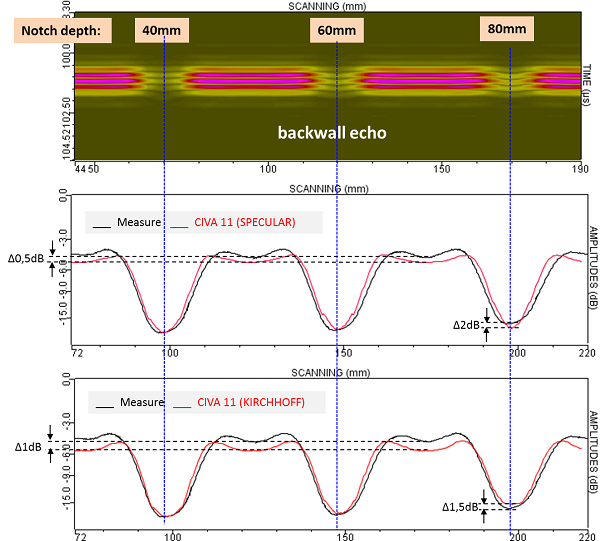
The 2 models provide a good prediction of the backwall echo shadowing (amplitudes calibrated with SDH amplitude).
When the backwall echo is non-shadowed, the maximal difference measured between simulation and experiment is 1 dB for both models.
When the backwall echo is shadowed, there is a difference between experiment and simulation only for the deepest flaw (80mm deep). The difference is 2dB for the SPECULAR model (under-estimation) and 1.5dB for the KIRCHHOFF model (overestimation).
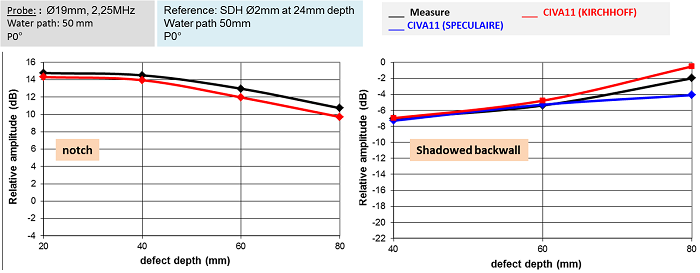
The amplitude evolution of the ribbons and of the shadowed backwall in function of the ribbons depth is presented below.
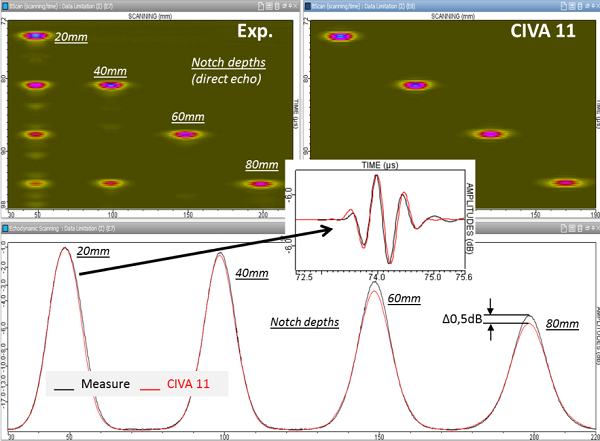
Experimental and simulated Ascan from the ribbons echoes and the shadowed backwall echo by each of the 3 defects is presented below.
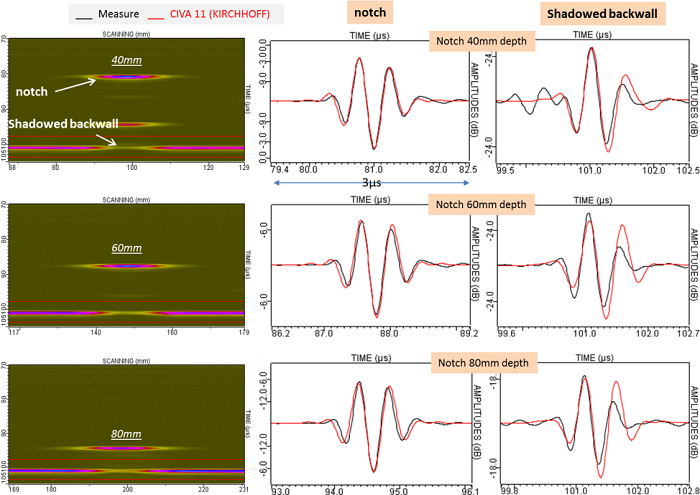
There is a very good agreement between simulated and experimental ribbons signals. There are some differences on the backwall echo shape directly above the flaw.
Results at 5 MHz
The echodynamic curves superimposition shows important differences between experiment and simulation when attenuation is not taken into account in CIVA. On the contrary, when attenuation is modeled, there is a very good agreement on amplitude and echodynamic curves (less than 2 dB).
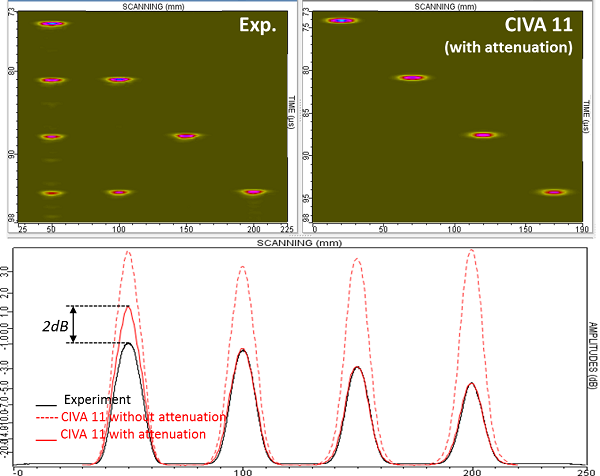
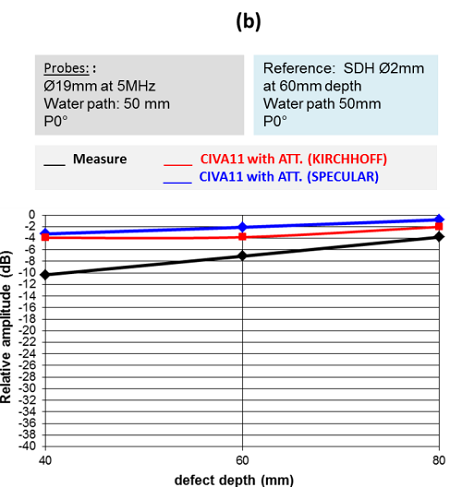
The amplitude evolution is presented below.
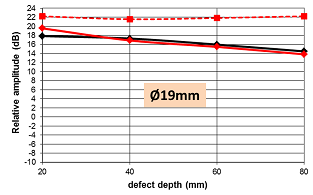
When attenuation is not taken into account in simulation, the difference between experiment and CIVA reaches 8dB on the 80mm depth ribbon echo. The results show that attenuation is correctly set since the observed differences between experiment and simulation are less than 1dB. A difference of 2 dB is observed for the 20mm depth ribbon but it is in the uncertainty measurements limits.
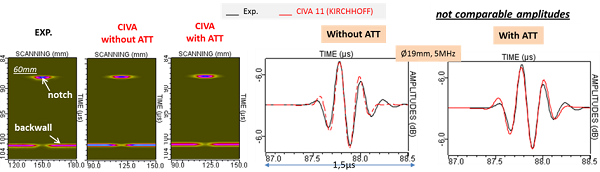
The figure below shows superimpositions of experimental and simulated (with and without attenuation taken into account) Ascans of direct echo from the ribbon at 60mm depth. Their shapes are in good agreement.
The figure below shows a comparison of echodynamic curves and backwall echoes measured directly above the flaw when using the Ø19mm probe at 5MHz. The 3 zones of weaker amplitude correspond to the shadowing to the ribbons located at 40, 60, and 80mm depth.
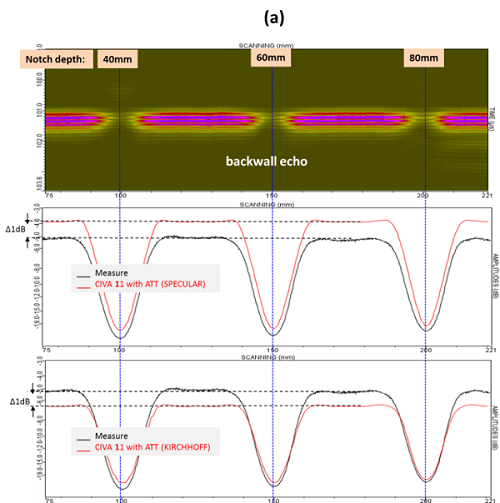
When the backwall echo is not shadowed:
The CIVA predictions with the SPECULAR and KIRCHHOFF models are in good agreement with experiment when attenuation is taken into account (the reference is a SDH). The amplitude differences between experiment and simulation are 1dB (overestimation for the SPECULAR model and underestimation for the KIRCHHOFF model).
When the backwall echo is shadowed:
Whatever the model used, the CIVA predictions are close. However, the simulated backwall echo amplitude evolution varies from the experimental one when the defect depth decreases. There are 2 or 3 dB differences between experiment and simulation for the backwall echo shadowed by the ribbon at 80mm depth and there are 6dB difference when the ribbon is at 40mm depth.
Continue to Results with the Ø12.7mm single element probe
Back to Shadowing