Results at 2.25 MHz
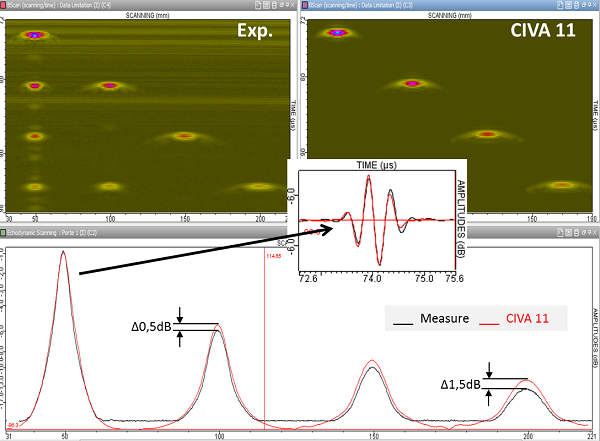
The figure below presents a superposition of simulated and experimental echodynamic curves with shadowing or not of the backwall echo. The results obtained with both models for backwall echo calculation are presented.
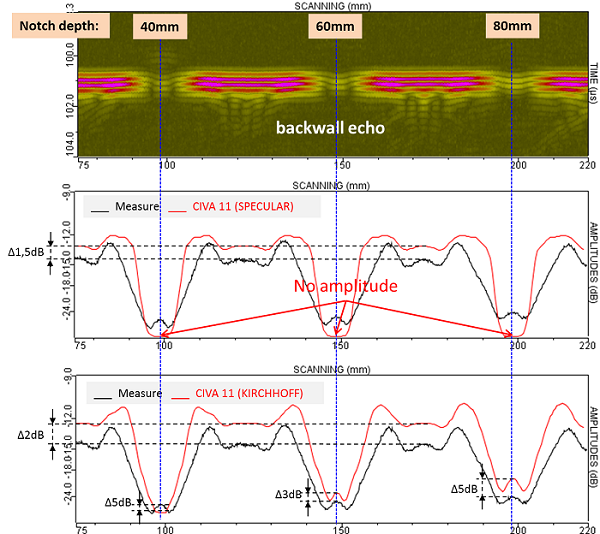
Regarding the non-shadowed part of the backwall echo:
The KIRCHHOFF and SPECULAR amplitudes are almost the same and present differences with experiment lower than 2dB.
Regarding the shadowed parts of the backwall echo:
The results obtained with the SPECULAR model present a total shadowing effect.
Regarding the KIRCHHOFF model, the tendency is well reproduced. Indeed, the shadowing effect is more important as the ribbon is far from the backwall. However, on the shadowed zone, the differences in amplitude are not negligible since they can reach 5dB for the ribbons located at 40mm and 80mm from the surface. Just like the previous case (Ø12.7mm probe), it is due to an underestimation of the shadowing effect for the deepest ribbon and an overestimation for the ribbon at 40mm depth. Note that for this depth, the amplitude overestimation just above the defect is not predicted by the model whereas it is for the 60mm and 80mm depth ribbons.
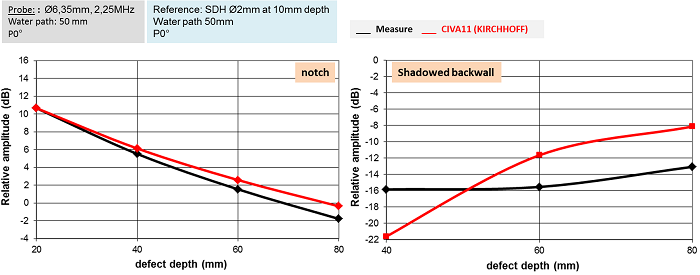
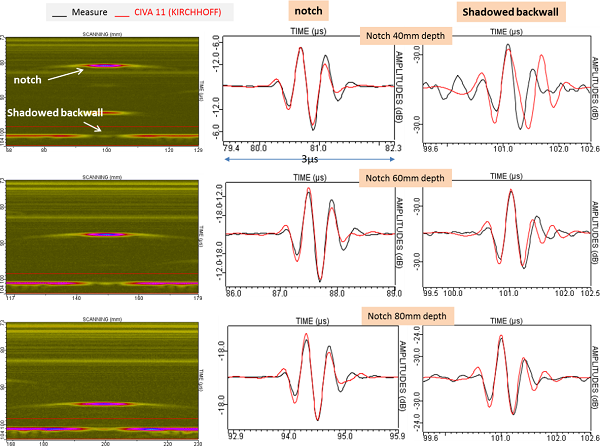
A comparison of Ascans extracted just above the ribbons is presented below. There is a good agreement on the echoes shape except for the shadowed echo backwall by the 40mm depth ribbon.
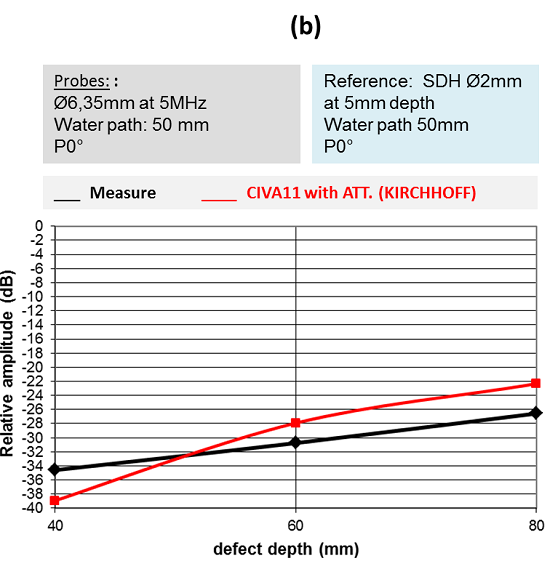
Results at 5 MHz
The echodynamic curves superposition shows important differences between simulation and experiment when the attenuation is not taken into account in CIVA. However, when attenuation is accounted for, there is a very good agreement (less than 2 dB differences) on amplitudes and echodynamic shapes.
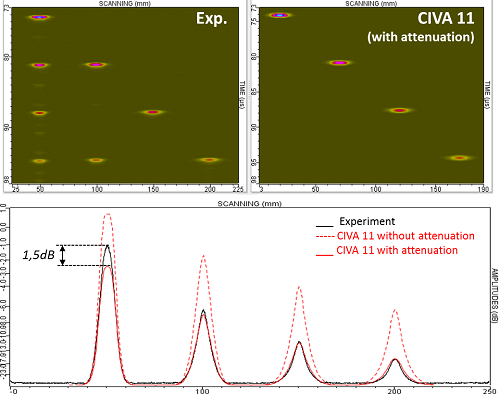
The figure below shows amplitude evolution.
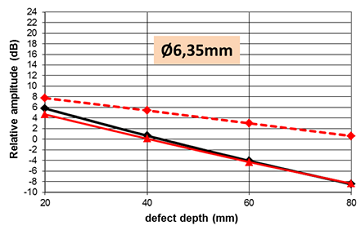
When attenuation is not taken into account in CIVA, the difference between simulation and experiment reaches 8dB for the 80mm deep defect. The amplitude comparison shows that the attenuation parameters are correct since the measured differences between simulation and experiment are most of the time less than 1dB.
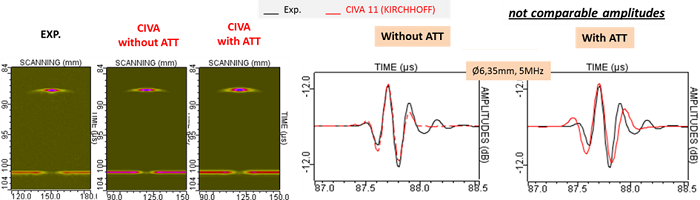
The figure below shows a superposition of simulated and experimental Ascans (with and without accounting for attenuation) of the direct echo of the 60mm deep ribbon. Their shapes are in good agreement.
The figure below shows a comparison of experimental and simulated (KIRCHHOFF and SPECULAR) echodynamic curves and amplitudes of the backwall echoes for the 5MHz, Ø6.35mm probe.
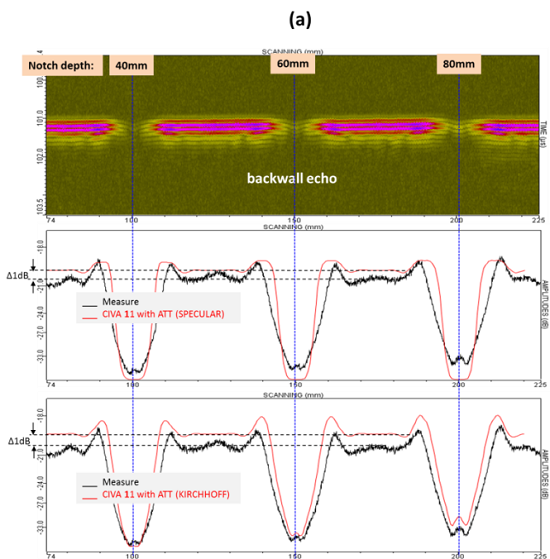
When the backwall echo is non-shadowed:
The non-shadowed backwall amplitudes are well predicted by CIVA whatever the model used for calculation (KIRCHHOFF or SPECULAR). For both models, 1dB difference is measured.
When the backwall echo is shadowed:
For this probe which aperture is less large than the defect width, the SPECULAR model predicts total shadowing. Regarding the KIRCHHOFF model, the tendency is well reproduced: the shadowing effect is more important as the ribbon is far from the backwall. The difference in amplitude between experimental and simulated shadowed backwall are around 4/5 dB.
Note that the differences between simulation and experiment for this frequency are less important than for lower frequency.
Continue to Comparison experiment / CIVA 2D / ATHENA 2D
Back to Shadowing