Global overview (C=Contact ; I=Immersion):
| Capteur | 2.0 MHz 20x22 mm | 5.0 MHz Ø6.35 mm | 2.0 MHz Ø12.7 mm | 2.25 MHz Ø12.7 mm | 5.0 MHz Ø12.7 mm | 2.25 MHz Ø19 mm | 5.0 MHz Ø19 mm |
| P0° | I | I | I | I | I | ||
| P45° | C | I | |||||
| SV45° | C | C | I |
CONFIGURATION
Some measurements have been carried out in P0°, P45° and SV45° modes upon a planar surface block containing a series of FBH of different diameters Ø 1 mm, 3 mm and 6 mm at different depths (from 5 to 60 mm with a step of 5 mm and then at à 80, 100, 125 and 150 mm). For P0° inspection, FBH are vertical, whereas they are tilted at 45° for P45° and SV45° inspections. The specimen and flaws are represented in the following figures.
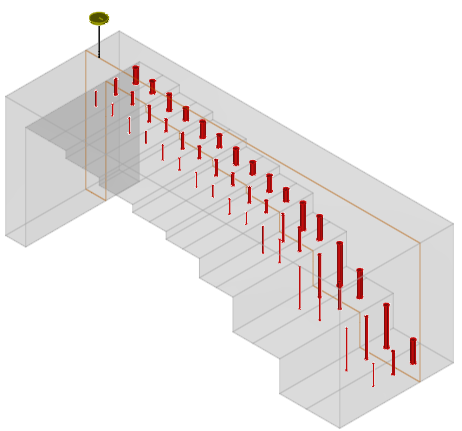
Mock-up with vertical FBH for P0° inspection
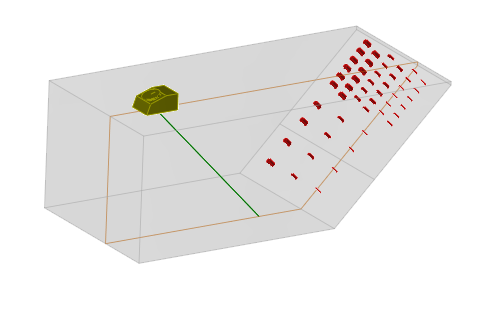
Mock-up with tilted FBH for P45° and SV45° inspections
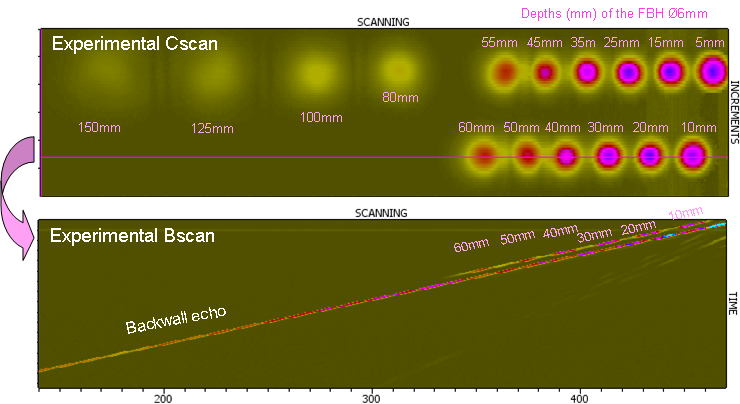
For each probe an inspection of the surface of the block is realized and a C-scan is obtained. In the C-scan image corresponding to the Ø 6 mm FBH, the backwall echo has been removed in order to enhance the FBH echoes. However the B-scan extracted on one line of holes shows the backwall echo and the FBH echoes.
For each hole the maximal amplitude of the specular echo of the FBH is measured relatively to a calibration hole. The interaction model is the Kirchhoff model which is adapted to specular echoes.
The measurements have been done with the following contact probes:
| Frequency | Crystal | Mode | Calibration flaw | Calibration depth |
| 2.0 MHz | 20x22 mm | SV45° | Ø3 mm FBH | 80 mm |
| Ø12.7 mm | SV45° | Ø2 mm SDH | 20 mm | |
| 2.25 MHz | Ø12.7 mm | P45° | Ø2 mm | 8 mm |
Other measurements have been carried out with the following immersion probes:
| Frequency | Crystal | Mode | Calibration flaw | Calibration depth |
| 2.25 MHz | Ø12.7 mm | P0° | Ø2 mm SDH | 12 mm |
| SV45° | Ø2 mm SDH | 12 mm | ||
| Ø19 mm | P0° | Ø2 mm SDH | 24 mm | |
| 4.6 MHz | Ø12.7 mm | P0° | Ø2 mm SDH | 24 mm |
| P45° | Ø2 mm SDH | 24 mm | ||
| Ø19 mm | P0° | Ø2 mm SDH | 60 mm | |
| 5.0 MHz | Ø6.35 mm | P0° | Ø2 mm SDH | 8 mm |
Results
The maximal amplitude of the specular echoes of the FBH is estimated relatively to a calibration reflector. The DGS curves are displayed for all the probes from simulated, measured or from literature data in the next figures.
The results show a good agreement in most cases.
single element contact probe 2.0 MHz, 20 x 22 mm, SV45°
For the 20 x 22 mm contact probe at 2 MHz, the SV45° mode is used for inspection. The input signal frequency is 2.0 MHz, the SV45° mode is used for inspection. The input signal frequency is 2.0 MHz, with 41% bandwidth and 75° phase
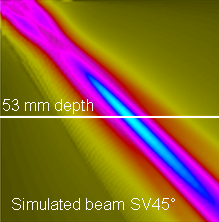
The acoustic focusing depth is 53 mm, deduced from the simulated beam as illustrated below.
The results are calibrated versus the Ø3 mm FBH at 80 mm depth.
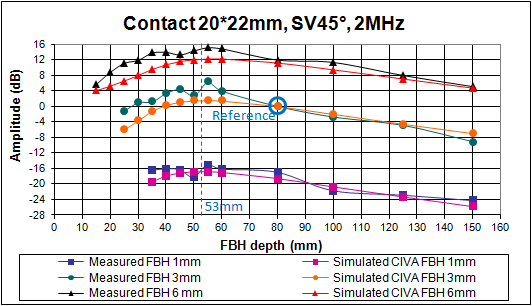
There is an overall good agreement with often less than 2 dB discrepancies. For smaller holes at smaller depths, CIVA slightly underestimates the amplitude of the echoes. Measured curves are less smooth than simulated curves. The irregularity is due to the material heterogeneity.
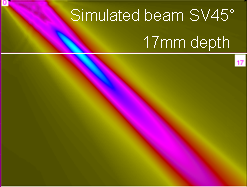
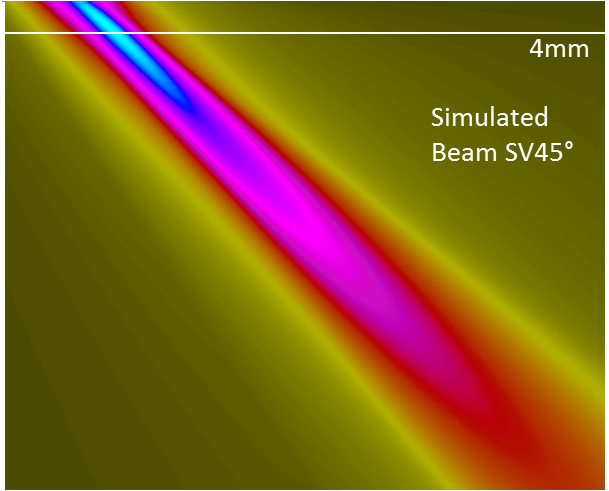
single element contact probe 2.0 MHz, Ø12.7 mm, SV45°
For the Ø12.7 mm circular contact probe at 2 MHz, the SV45° mode is used for inspection. The input signal is the inverse P45° experimental direct specular echo of a FBH Ø3 mm, tilt 45° at 30 mm depth.
The acoustic focusing depth is 17 mm, deduced from the simulated beam illustrated below.
The results are calibrated versus the Ø2 mm SDH at 20 mm depth in another block inspected with SV45° waves.
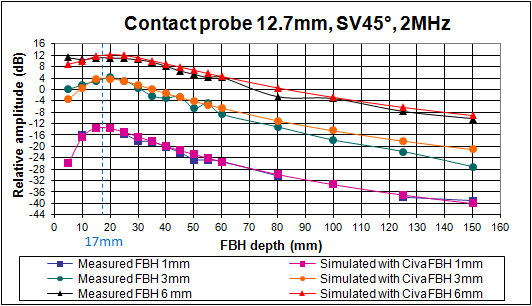
Even if the curves from CIVA are smoother (steel heterogeneity), there is a good agreement between measure and simulation for Ø1 mm FBH and Ø6 mm FBH. CIVA overestimates the echo from the Ø3 mm FBH, from 2 dB (at 60 mm depth) to 6 dB (at 150 mm depth).
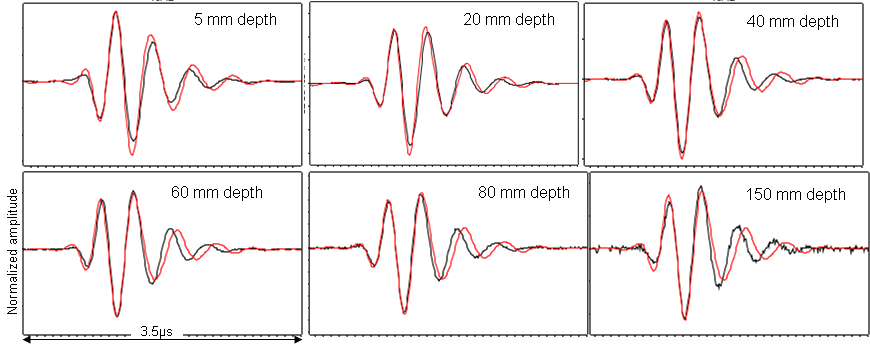
In addition to the good agreement in amplitude between simulated data and experimental data, the waveforms also show a very good agreement.
The following curves superimpose the direct specular echo from Ø6 mm FBH at different depths obtained with the 2 MHz contact Ø12.7 mm probe generating SV45° waves. The experimental curves are in black and the simulated data are in red.
single ElEment contact probe 2.25 MHz, Ø12.7 mm, P45°
For the Ø12.7 mm circular contact probe at 2.25 MHz, the P45° mode is used for inspection. The input signal frequency is 2.25 MHz, with 50% bandwidth and 280° phase.
The acoustic focusing depth is 8 mm, deduced from the simulated beam illustrated below..
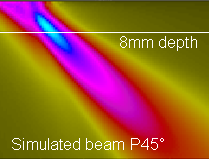
The results are calibrated versus the Ø2 mm SDH at 8 mm depth in another block inspected with SV45° waves.
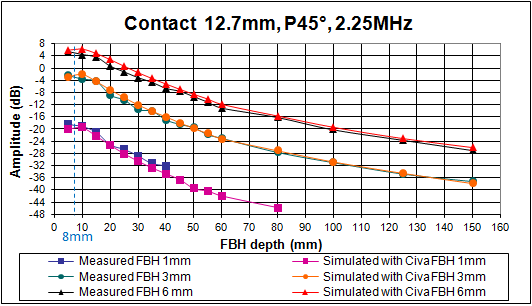
The curves show a good agreement between measure and simulation with less than 2 dB difference for the 3 FBH sizes. Experimental curves are less smooth than tsimulated ones. This is due to the material heterogeneity.
single Element P0° immersion probe 2.25 MHz, Ø12.7 mm
For the Ø12.7 mm circular immersion probe at 2.25 MHz, the P0° mode is used for inspection with a 50 mm water path. The input signal frequency is 2.25 MHz, with 60% bandwidth and 0° phase.
The acoustic focusing depth is 4 mm, deduced from the simulated beam illustrated below.
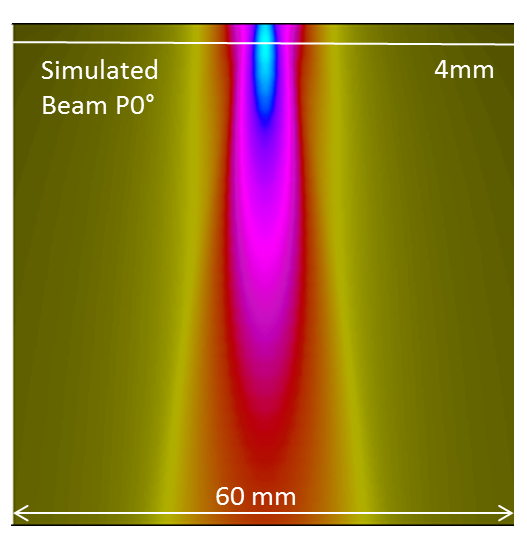
The results are calibrated relarively to the Ø2 mm SDH at 12 mm depth in another block inspected with P0° waves.
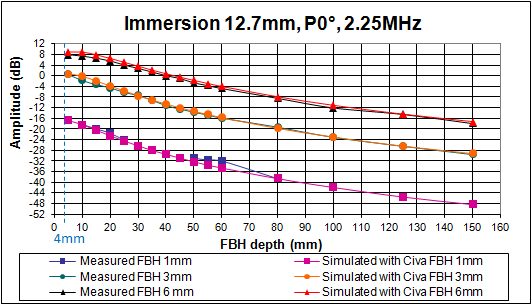
The simulated and experimental curves show a good agreement. There are less than 2 dB difference for the 3 FBH sizes.
single ElEment SV45° immersion probe, 2.25 MHz, Ø12.7 mm
For the Ø12.7 mm circular immersion probe at 2.25 MHz, the SV45° mode is used for inspection with a 50 mm water path. The input signal frequency is 2.25 MHz, with 60% bandwidth and 0° phase.
The acoustic focusing depth is 4 mm, deduced from the simulated beam illustrated below.
The results are calibrated versus the Ø2 mm SDH at 12 mm depth in another block inspected with P0° waves.

The curves show a good agreement between experiment and simulation with less than 2 dB difference for the 3 FBH sizes. Experimental curves are less smooth than simulated curves, which is still due to the material heterogeneity.
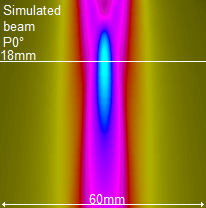
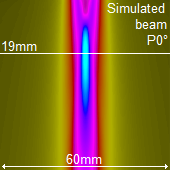
single ElEment P0° immersion probe 2.25 MHz, Ø19 mm
For the Ø19 mm circular immersion probe at 2.25 MHz, the P0° mode is used for inspection with a 50 mm water path. The input signal frequency is 2.25 MHz, with 60% bandwidth and 0° phase.
The acoustic focusing depth is 18 mm, deduced from the simulated beam illustrated below.
The results are calibrated relatively to the Ø2 mm SDH at 24 mm depth in another block inspected with P0° waves.
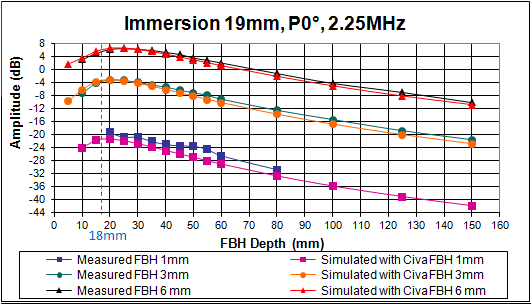
There is a good agreement between measure and simulation with less than 2 dB discrepancy for 3 and 6 mm FBH. For 1 mm FBH, discrepancies of 3 to 4 dB appear for reflectors deeper than 50 mm.
single ElEment P0° immersion probe 4.6 MHz, Ø12.7 mm
The acoustic focusing depth is 19 mm, deduced from the simulated beam illustrated below.
The results are calibrated versus the Ø2 mm SDH at 24 mm depth in another block inspected with P0° waves.
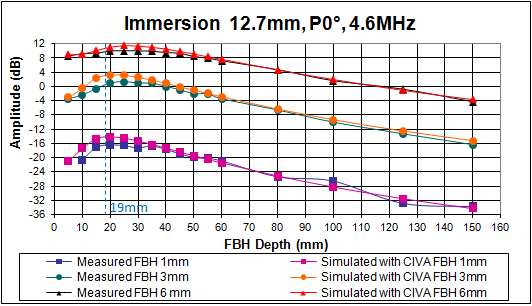
Deeper than 20 mm, the curves show a good experiment-simulation agreement with less than 2 dB discrepancy for the 3 FBH sizes. Discrepancies can reach 4 dB in the first 20 mm, which can be explained by CIVA near field limitation.
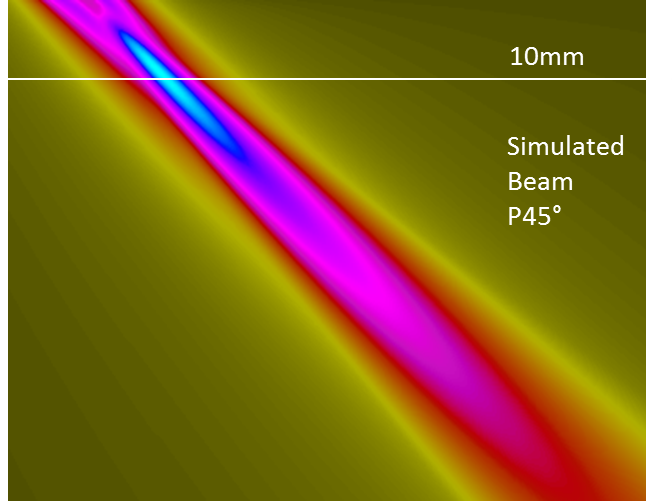
single ElEment P45° immersion probe 4.6 MHz, Ø12.7 mm
For the Ø12.7 mm circular immersion probe at 4.6 MHz, the P45° mode is used for inspection with a 50 mm water path. The input signal frequency is 4.6 MHz, with 65% bandwidth and 220° phase.
The acoustic focusing depth is 10 mm, deduced from the simulated beam illustrated below.
The results are calibrated versus the Ø2 mm SDH at 24 mm depth in another block inspected with P0° waves.
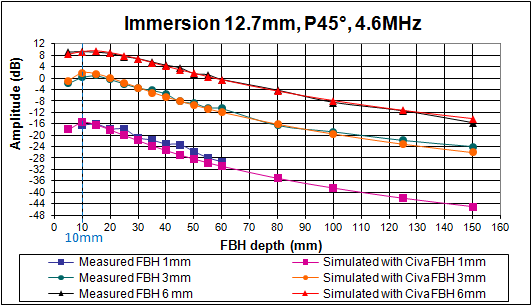
The curves show a good agreement between measure and simulation with less than 2 dB difference for the 3 FBH sizes except for the 1 mm FBH at 45 mm. In this case the experimental curve is less smooth (steel heterogeneity) and the discrepancy reaches 4 dB.
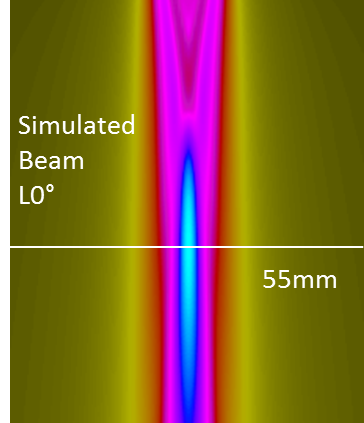
single ElEment P0° immersion probe 4.6 MHz, Ø19 mm
The acoustic focusing depth is 55 mm, deduced from the simulated beam illustrated below.
The results are calibrated versus the Ø2 mm SDH at 60 mm depth in another block inspected with P0° waves.
The curves show a good agreement between measure and simulation with less than 2 dB discrepancy for 3 and 6 mm FBH, particularly deeper than 45 mm. Otherwise, for 1 mm FBH, discrepancies are up to 6 dB, probably because of the "small defect" limitation of Kirchhoff interaction model.
single ElEment P0° immersion 5.0 MHz, Ø6.35 mm
For the Ø6.35 mm circular immersion probe at 5 MHz, the P0° mode is used for inspection with a 50 mm water path. The input signal frequency is 5.0 MHz, with 70% bandwidth and 255° phase.
The acoustic beam is illustrated below.
The results are calibrated versus the Ø2 mm SDH at 8 mm depth in another block inspected with P0° waves.
The curves show a good experiment-simulation agreement with less than 2 dB discrepancy.
Continue to Influence of the tilt of the probe
Back to Flat Bottom holes
Back to Calibration defects