Superimposition of time signal curves in CIVA TT
To compare time signal curves at several positions of the same thermogram obtained from a simulation in the Thermal Testing module of CIVA, you have to use the “Cursor connection/Disconnection” button:

In an analysis page, it is necessary to display:
- The thermogram, in order to position the cursors at the different areas of interest to be analyzed.
- As many “Time Signal” images as areas to be analyzed.
The methodology for superimposing the curves is as follows:
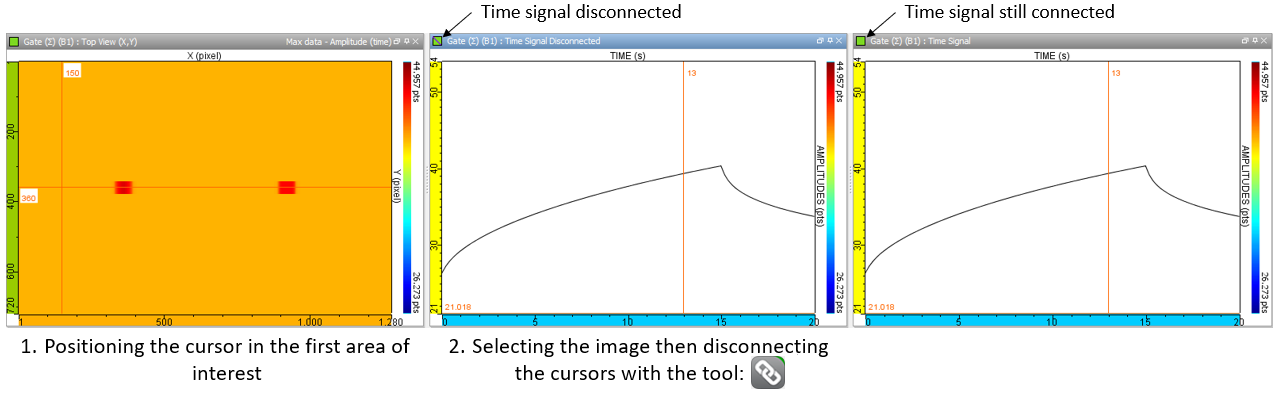
- Position the cursor in the first area of interest (e.g., non-defective area).
- Select the time signal image, and use the “Cursor connection” tool so that the view is no longer synchronized with the cursors. The curve will then be “frozen” for the initial cursor position in the thermogram.
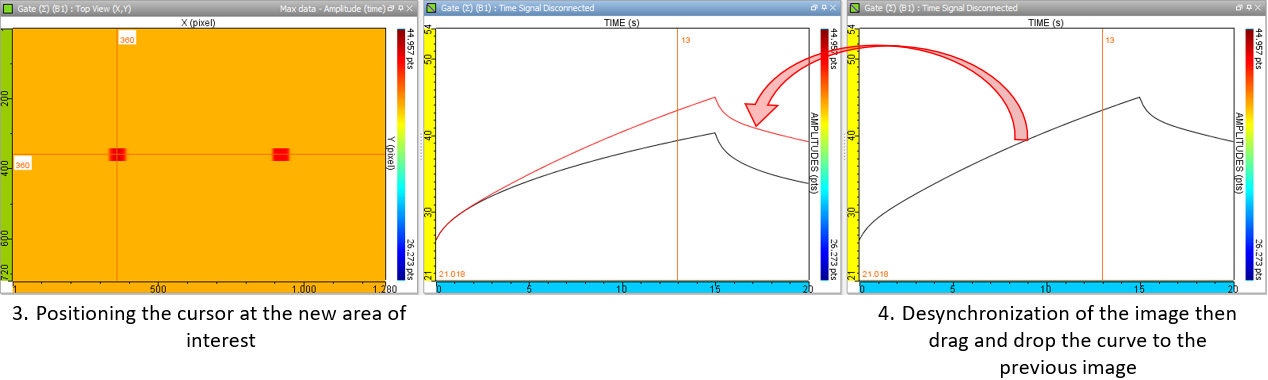
- Position the cursor at the new area of interest (e.g., first flaw on the left).
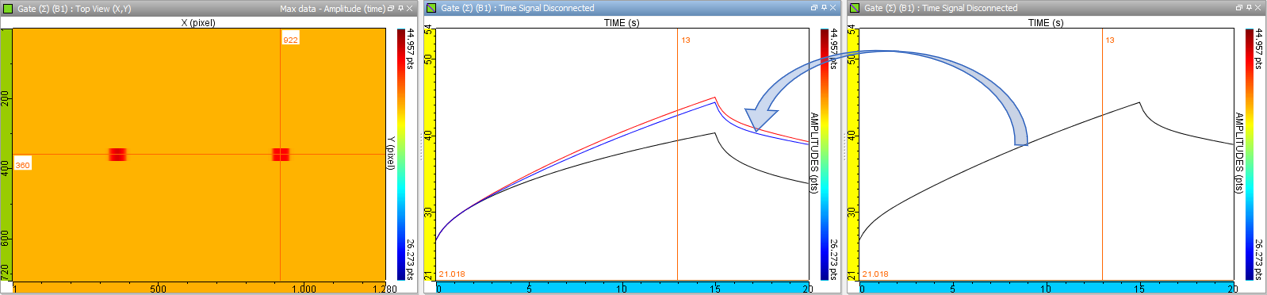
- Desynchronize the time signal image in order to freeze this second curve at the new cursor position. Then, drag and drop from the curve to the previous image in order to compare both time signals by superimposition.
- Repeat these steps for each area of interest.