
Optimization of calculation time in CIVA RT/CT: Detector degradation for a Monte-Carlo calculation
A new feature has been developed in CIVA RT/CT to reduce the calculation time of configurations that take into account the Monte-Carlo calculation (contribution of scattered radiation).
It is now possible to degrade the resolution of the detector during the Monte-Carlo calculation and to merge this result with the result obtained by the Beer-Lambert calculation (contribution of direct radiation) for which the detector is not degraded (and thus is defined as entered by the user in the detector panel).
The value to be entered is a percentage of degradation.
This functionality is accessible from the “Options / Simulations” menu, Monte-Carlo section. The desired percentage of degradation is to be entered in the box “Detector degradation of total pixels number”.
The percentage of degradation relates to the total number of pixels and is carried out at constant detector size. It therefore results in the pixels being artificially “magnified”.
For example, if a resolution degradation of 75% is applied to a detector containing 2E06 pixels and measuring 10 cm × 20 cm, the Monte Carlo calculation will be performed on 0.25 × 2E06 = 5E05 pixels, and the detector will still measure 10 cm × 20 cm. Pixels for which the Monte Carlo has not been calculated will take the value of the nearest neighbour.
This degradation of the detector resolution has an impact on the number of photons to be modelled, and thus on the resolution time of the Monte Carlo calculation (i.e. the fewer pixels on the detector, the lower the number of photons necessary to ensure the convergence of the Monte Carlo calculation is).
When the percentage of degradation applied to the detector is too high, the “Combined Energy Scattered” images can take on an unusual appearance (inhomogeneities) (see image below). It is therefore important to check this image to ensure that the degradation factor applied is relevant.
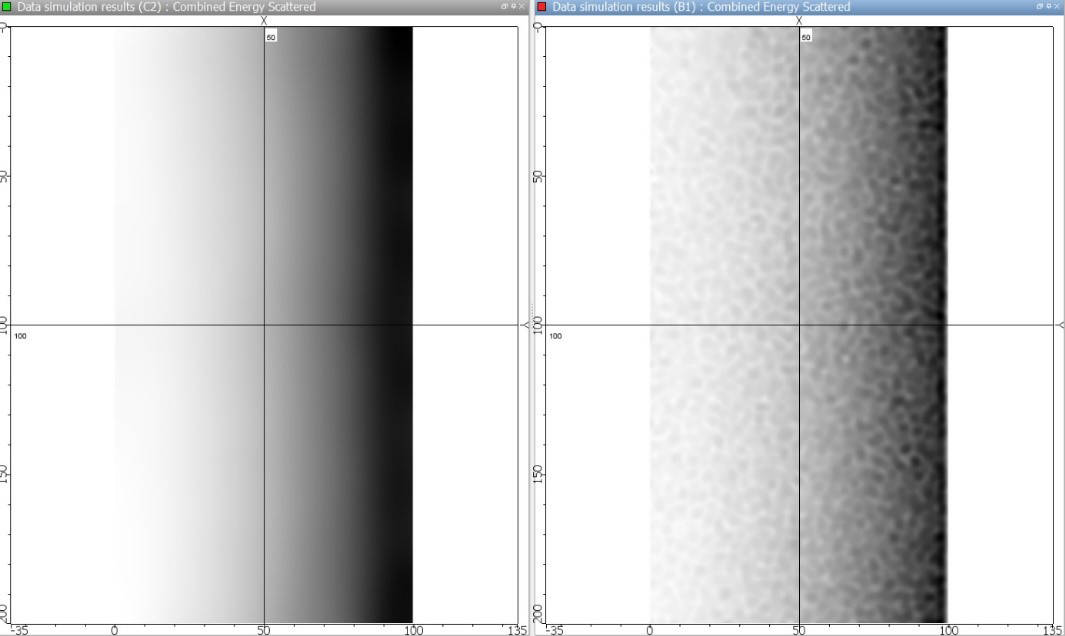
“Combined Energy Scattered” images for two degradations of detector.
Left: Degradation of 0% (detector without degradation). Right: Degradation of 95% (detector too degraded).