How to display and calibrate variation curves in dB or %
By default, the variation curve of an extracted quantity (Amax for example) is a function of one of the varying parameter in CIVA points.
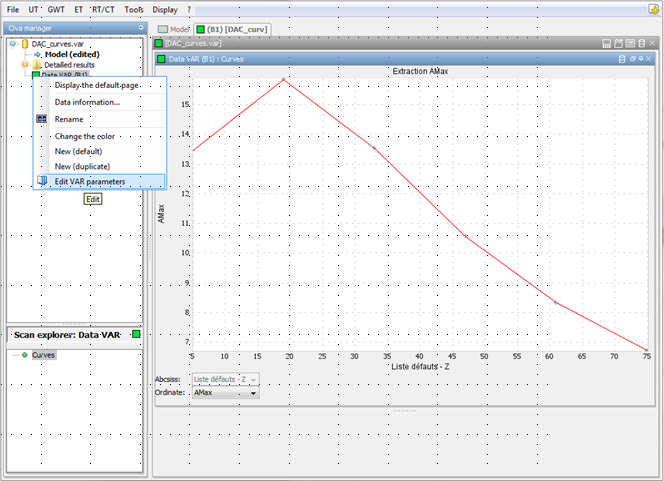
It is possible to calibrate the curve according to a reference chosen by the user in order to display it in dB or %. To do so, in the CIVA manager, right-click on the result and edit the variation parameters.
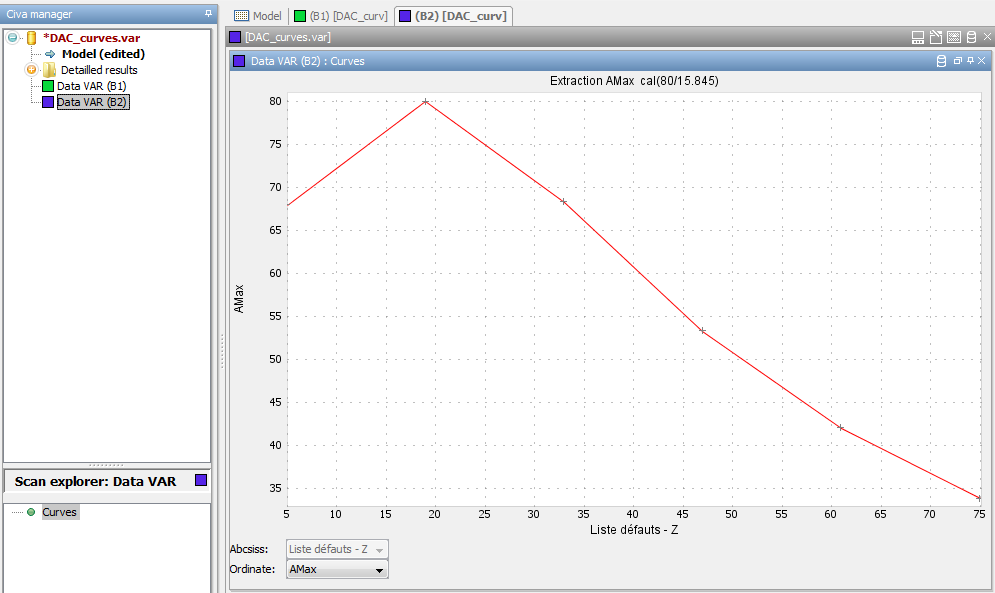
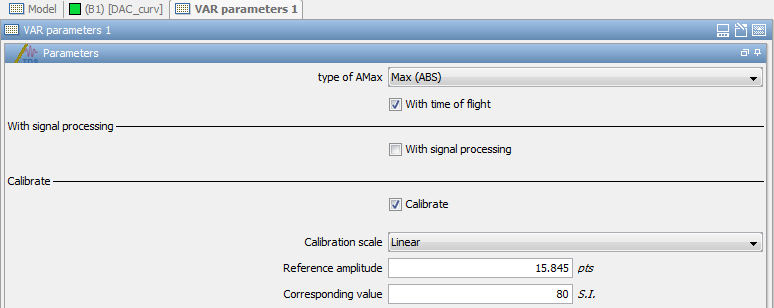
A new window opens where you can tick the option “calibrate”. Then, you have the possibility to choose between a calibration in dB or in % (linear scale). According to the chosen calibration scale, you have to specify the reference amplitude (for dB scale) and the corresponding value (for linear scale). In the example below, the reference amplitude corresponds to the highest Amax value in CIVA points, and the corresponding value relates to the percentage it will be associated with after calibration.
Click on the “New” button at the bottom of the window. The calibrated result is then displayed in a new window and appears in the CIVA manager.