Visualization of ultrasonic propagation
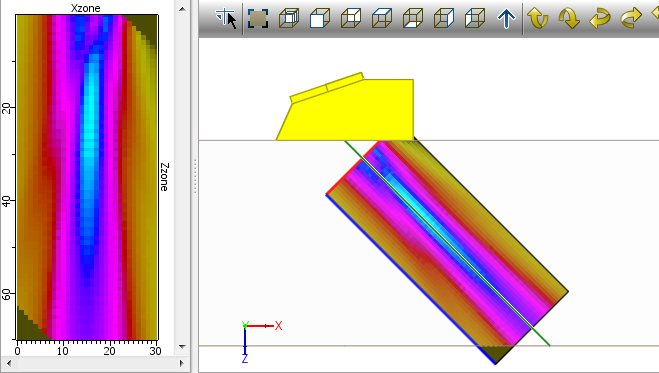
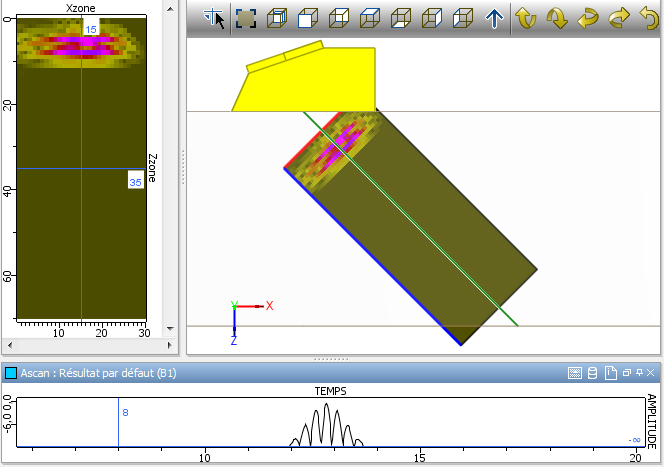
After performing a beam computation with CIVA or a beam extraction within CIVA-ATHENA2D, the software displays by default for each computation point the maximum amplitude of the received beam. On the following figure, the beam extends from the probe to the specimen backwall.
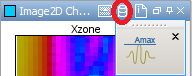
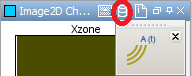
The visualization of the beam propagation is necessary for some configurations, in particular to illustrate some phenomena with CIVA-ATHENA2D. To display it, switch in the data tools from Amax to A(t).
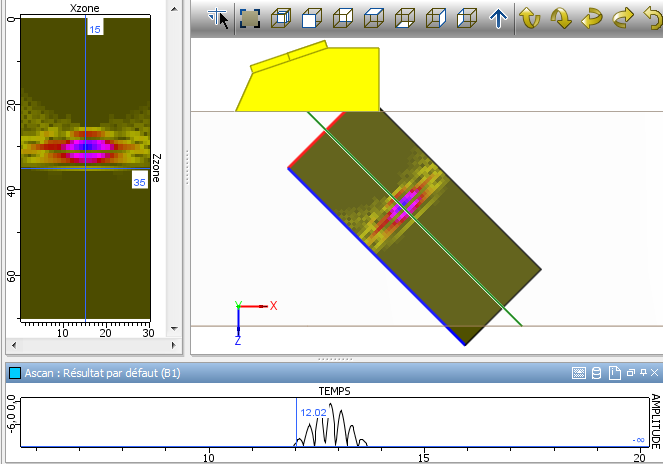
The obtained 2D image depends on the time. Adjust the time cursor of the A-scan to visualize the propagation at different times of flight in the 2D image or the 3D view.
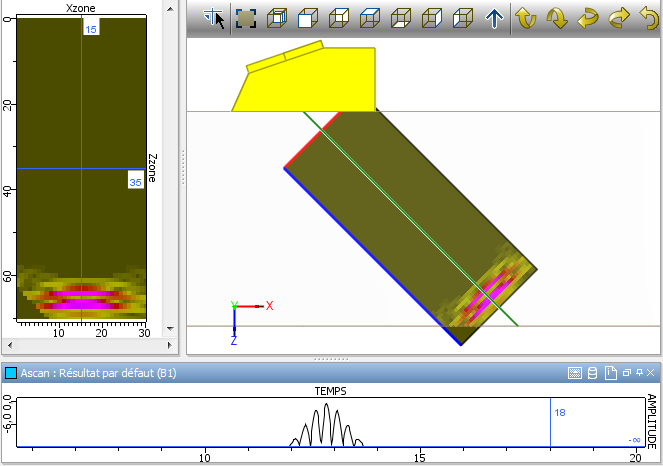
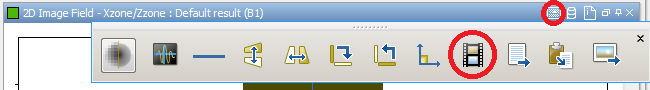
It is also possible to generate a video file by clicking on the dedicated button.