
“Adjacent configurations” option for POD computations
A POD curve describes the probability for a NDT system to detect a flaw with respect to its size and accounting for variable (i.e. “uncertain”) influential parameters. POD curves can be computed through simulation with CIVA software thanks to dedicated tools that have been available for more than 10 years now.
A POD curve is usually associated with one acquisition channel. But sometimes, it can also be relevant to plot POD curves considering inspection data coming from several channels, if these sensors are associated to detect the same range of defects in the specimen inspection. It is also possible to do that in CIVA thanks to the “Adjacent Configurations” option available since CIVA 2020.
Let’s take the example of a weld UT inspection illustrated by the image below. A first channel (“blue sensor”) aims at inspecting the volume of the weld on the inner side of the pipe, while another channel targets more the Heat Affected Zone.
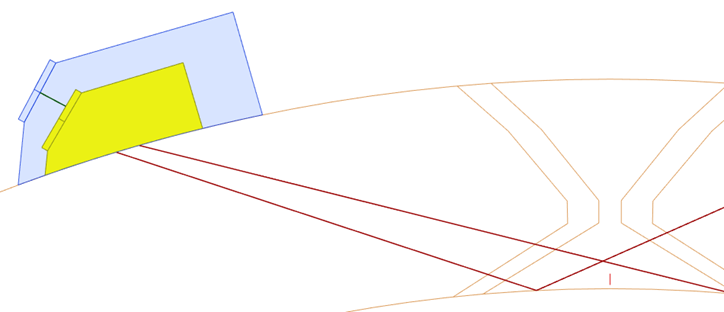
Weld UT inspecion example
Of course, if you want to compute the Probability of Detection of longitudinal cracks located in the inner volume of the weld, you first have to consider the “dedicated” channel. But it can be also relevant to take into account the “neighbour” channel that may detect cracks that could be missed by the initial channel.
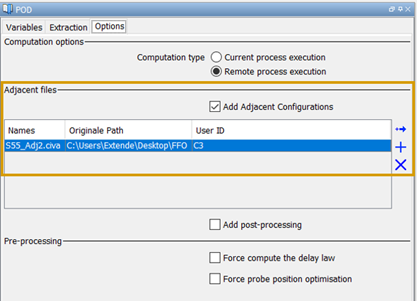
POD Panel
To do that, you first have to define the POD simulation model of the “dedicated” channel and the different flaw sizes and variable parameters you want to consider. Then, you just have to associate the neighbour channel(s), by loading the relevant CIVA configuration(s) in the “Add Adjacent Configurations” menu available in the “Options” tab of the POD panel. Then, CIVA will apply the POD computation scenario for both probes, and will take into account the maximum signal obtained between the 2 channels for each defect in the final POD curve.
In this case, the first POD curve was obtained when considering only the “dedicated” channel. The famous POD criterion a90/95 (the defect size from which you have 90% of Probability of Detection with 95% confidence) was evaluated at 1.66mm. On the second curve, the adjacent channel “C3” has been included in the POD study. Since many “hits” are obtained with this new channel (some of them are displayed with red crosses on the graph below), the resulting a90/95 is now evaluated at 1.26mm.
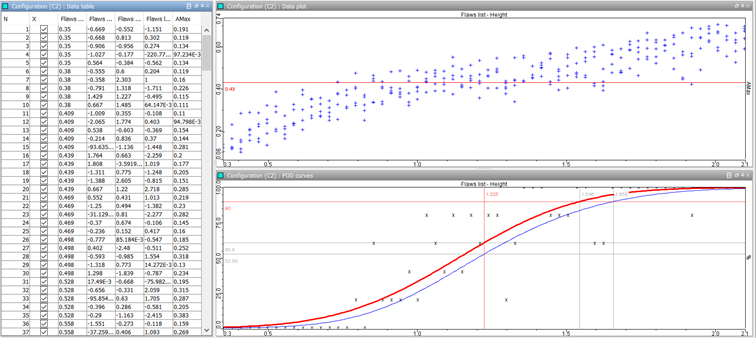
Initial POD curve
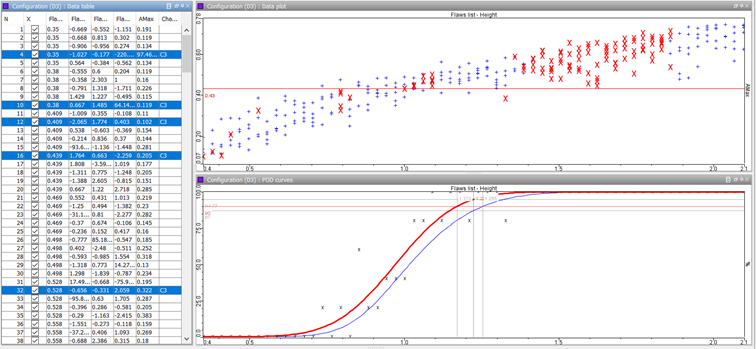
POD curve including the “adjacent channel”