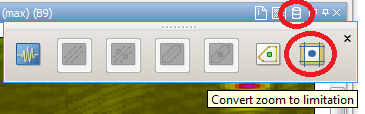
Convert zoom to limitation
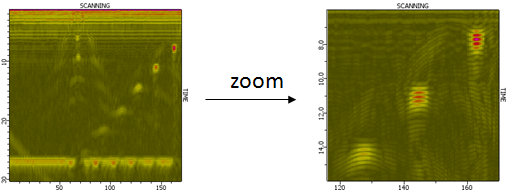
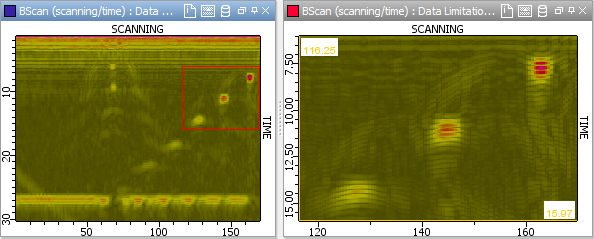
It can be useful during analysis to reduce the studied data set. The following acquired results deal with responses from different Side Drilled Holes in a calibration block. This example focuses on the responses from the 3 SDH on the top right of the main B-scan image.
After zooming in any view that is not a reconstructed view (A-scan, B-scan, C-scan, echodynamic…), the magic button “Convert zoom to limitation” is available from the data tool.
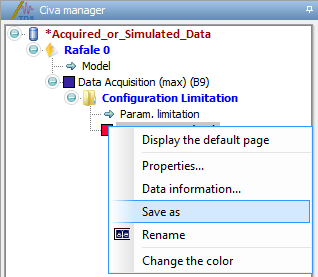
A new dataset appears in the current configuration tree of Civa manager. It is then possible to display the limitation result in a new analysis page.
The limitation parameters are displayed in an additional view on the left of the CIVA window. The values correspond to the limits of the not True view from which the “Convert zoom to limitation” button has been applied.
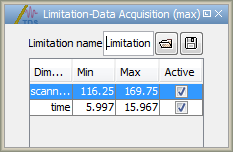
A red rectangle also displays the limitation in the original B-scan. The limitation can be adjusted by dragging the limits of the rectangle or entering values in the previous window.
For an easier analysis, it is possible to save only the limited data. Then, one can load only the useful information, and for example apply signal processing.