
Corner echoes with SV mode: Influence of the notch height
Summary
Two experiments have been performed in order to study the influence of the notch height, one for contact probes and one for immersion probes.
CONFIGURATION for CONTACT probes
To study the influence of the notch height, contact inspections are performed on a planar 30 mm thick specimen containing backwall breaking notches that differ only by their height (same depth, same length). In the first mock-up the notch dimensions are 10×40 mm; in the second one the notch dimensions are 3.2×40 mm.
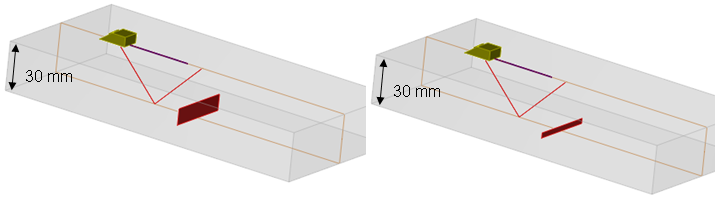
The inspection is performed with a circular contact probe of Ø6.35 mm diameter generating SV45 waves. The input signal has a center frequency of 2.25 MHz, a bandwidth of 44% and a phase of 147°.
ReSULTS for CONTACT probes
The results are calibrated relatively to a Ø2 mm SDH of 40 mm length located at 28 mm depth.
| Experimental (dB) | Simulated (dB) | Difference (dB) | |
| SDH of Ø2 mm (28 mm depth) | 0 | 0 | 0 |
| Notch of 10 mm | 14.0 | 15.0 | +1.0 |
| Notch of 3.2 mm | 12.0 | 13.5 | +1.5 |
The comparison between experimental and simulated results shows good agreement. The maximal difference is 1.5 dB.
CONFIGURATION for IMMERSION probes
In the following configuration, the specimen is a ferritic steel planar mock-up of 30 mm thickness containing backwall breaking notches. These notches are 15 mm long and have different heights: 0.5 mm, 1 mm, 1.5 mm, 2 mm, 3 mm, 4 mm, 5 mm, 7.5 mm, 10 mm, 12.5 mm and 15 mm.
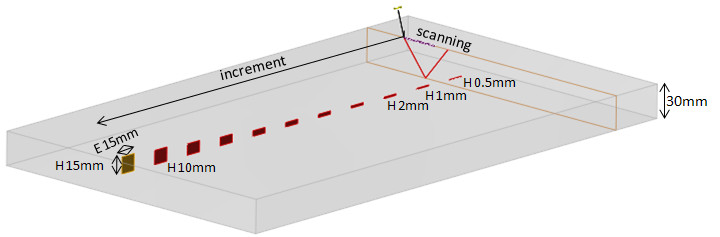
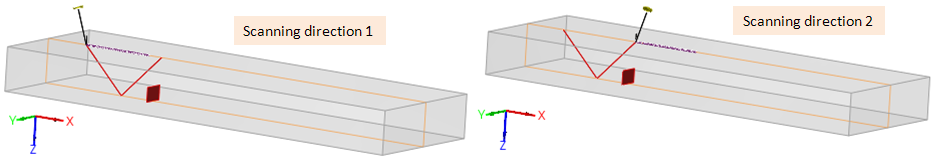
In order to check the specimen homogeneity and the measurements reproducibility, the inspections are performed with all probes in two scanning directions.
Three immersion probes were used:
| Frequency ( MHz) | Crystal | Mode | Water path | Calibration depth |
| 5 MHz | Ø6.35 mm | T45 | 25 mm | 20 mm |
| 2.25 MHz | Ø12.7 mm | T45 | 25 mm | 20 mm |
| 2.24 MHz | Ø6.35 mm | T45 | 25 mm | 20 mm |
ReSULTS for IMMERSION probes
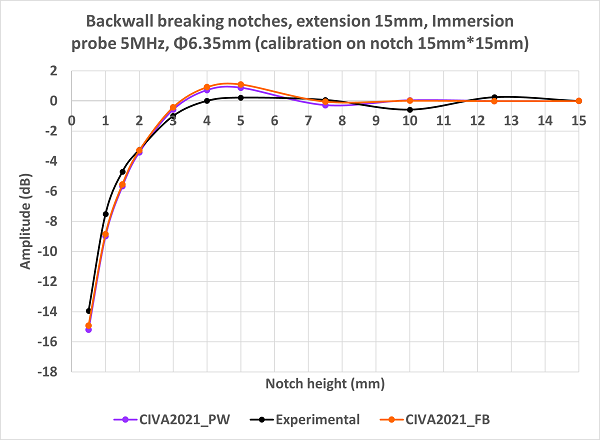
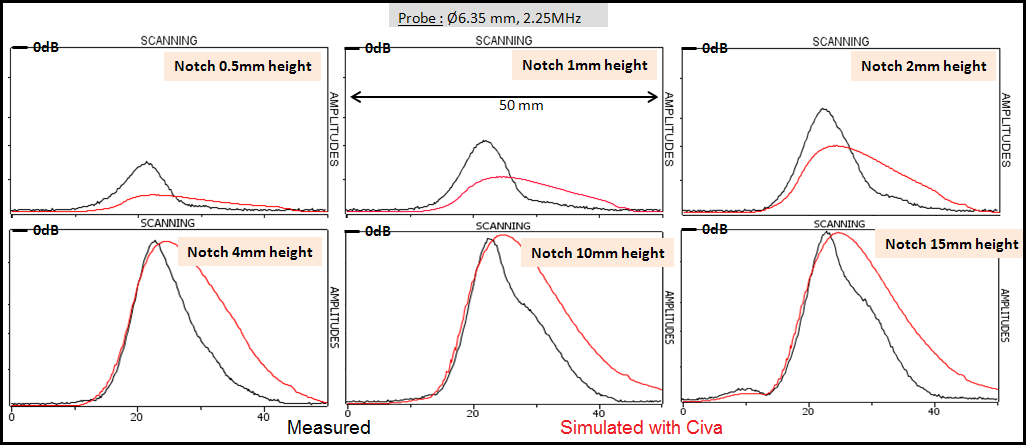
The Ø6,35 mm circular immersion probe, functionning at 5 MHz with 25 mm water path was used to perform a SV45 inspection. The input signal frequency is 5 MHz, with 66% bandwidth and 300° phase.
Updated results: These results are obtained with CIVA 2021. Experimental results (in black) are compared to simulation results from different models available (FB = Full Beam; PW = Plane Wave approximation).
The results are calibrated relatively to the notch of dimensions 15×15 mm.
The echodynamic and the A-scan curves are stored at the maximal amplitude.
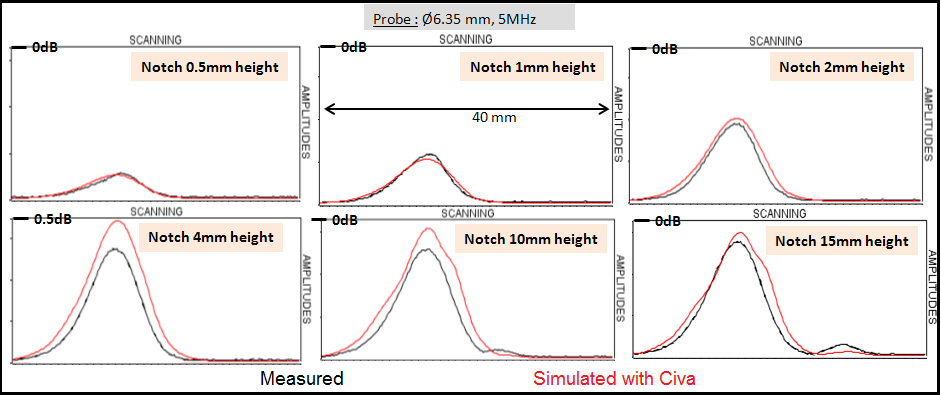
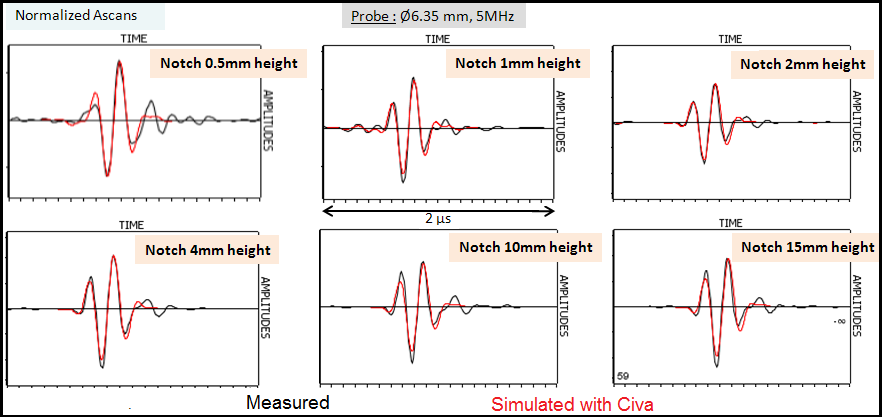
At 5 MHz, a good agreement is observed on the echodynamic curves between experiments and simulation: the A-scans and the amplitudes present less than 2 dB discrepancies, which is less than the experimental uncertainty.
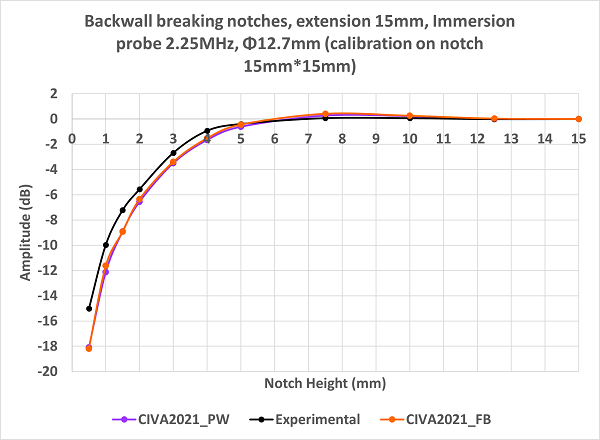
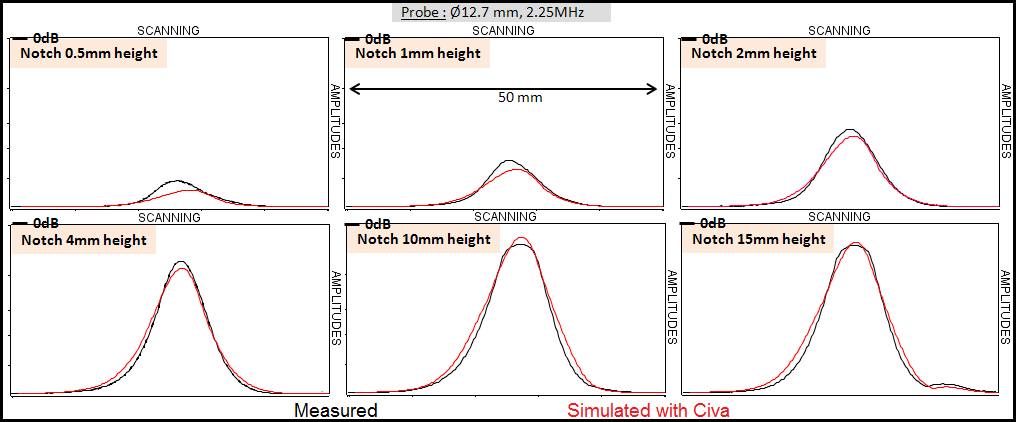
The Ø6,35 mm and Ø12,7 mm circular probes were used to perform a SV45 inspection with a water path of 25 mm. The Ø6.35 mm probe has a center frequency of 2.24 MHz, a bandwidth of 61% and a phase of 300°. The Ø12.7 mm probe has a central frequency of 2.25 MHz, a bandwidth of 61% and a phase of 0°.
Updated results: These results are obtained with CIVA 2021. Experimental results (in black) are compared to simulation results from different models available (FB = Full Beam; PW = Plane Wave approximation, FEM = Finite Element Model).
New simulations have been run to check if the updates of these models lower some differences with experimental data observed with the version used at this time.
The results are calibrated relatively to the notch of dimensions 15×15 mm.
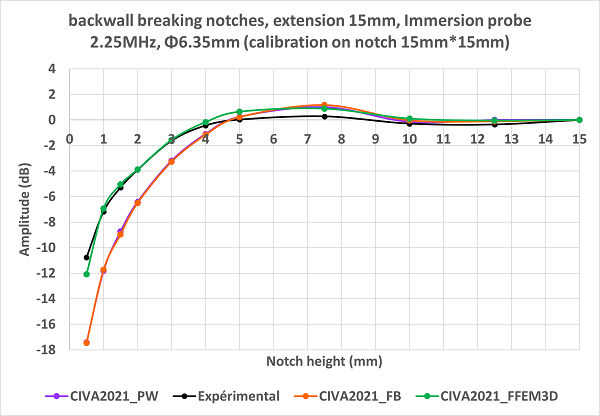
With the Ø6.35 mm probe, the plane wave approximation and full beam models for beam/defect interaction under-estimate the corner echoes amplitudes of the smallest notches. However, the Finite Element Model results are in a very good agreement with experimental amplitudes. Indeed, with FEM there is no limitation on the notch size (small defect limit) contrary to the PW and FB models.
Results obtained with the Ø12.7 mm diameter probe are in good agreement with experiment. The agreement between simulation and experiment is a bit lower for the 0.5 mm high notch (simulated amplitude under-estimated by 3 dB).
Echodynamic curves and A-scan at the maximum amplitude are saved; differences can be noticed for all the notches.
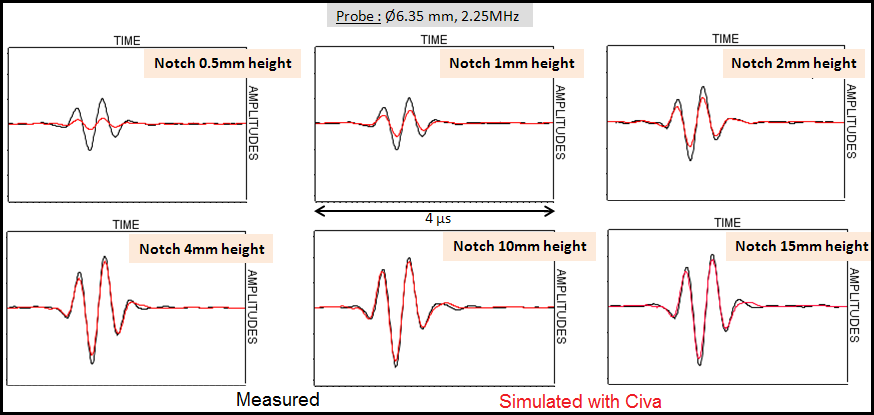
Experimental and simulated A-scans show good agreement even for the smallest notches which amplitudes are not so well estimated.
The experimental and simulated echodynamic curves obtained with the Ø12.7 mm diameter probe present less differences than with the Ø6.35 mm diameter probe.
These results highlight that the notch height affects the CIVA prediction of the SV corner echo corner. When varying the notch height, three phenomena may contribute to the discrepancies between experimental and simulated results. These differences occur for the smallest notches. They could be due to the “small defect” limitation of the Kirchhoff model and may vary with the frequency. The results are less accurate with the smallest probe where beam divergence and critical contributions are largely responsible for the observed differences. Furthermore, the differences observed on the echodynamic curves are similar to the one obtained with SDH, the beam modelization inaccuracy may also be an additional cause.
For some notches, the effects from these 3 phenomena are combined and cannot be separated.
Continue to Influence of the notch length
Back to Corner Echoes with SV mode
Back to Corner Echoes