
UT – Multiple Echoes: Linear array, 3 MHz, null delay laws
Measurements were performed on two blocks of 5 mm and 20 mm thickness, with 25 mm and 50 mm water path respectively, for three sequences of 8, 16 and 24 active elements and for 0°, 1° and 2° incidence angles. A null delay law has been applied.
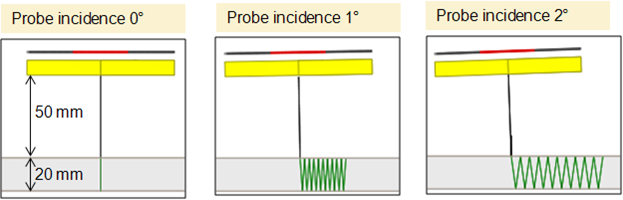
20 mm thickness block and 50 mm water path
Results are calibrated from a Ø6 mm SDH, located at 150 mm depth, a 25 mm water path and a null delay law. Amplitudes of the surface echo (echo n°0), of the first backwall echo (echo n°1) and of the following backwall echoes are plotted below in black for experimental measurements, in red for Kirchhoff model results and in blue for specular model results for three angles and three different active elements.
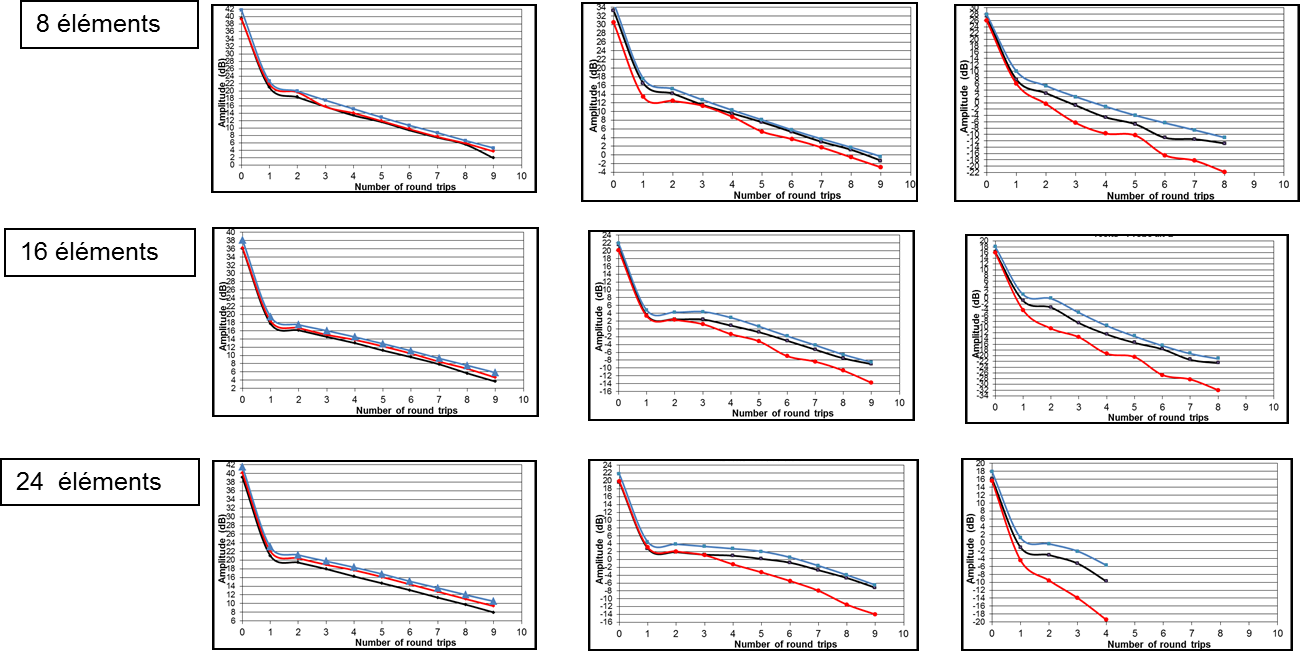
The specular model predicts correctly all echo amplitudes, overestimating very slightly with less than 2 dB discrepancy in most cases. The maximum gap is observed with 24 active elements and a 2° tilt angle, and reaches only 4 dB.
The Kirchhoff model predicts good results when the tilt angle remains null. Then, as the tilt angle increases, the number of active elements and the number of rebounds, the echo amplitudes overestimation by Kirchhoff model increases, until 10 dB for the last rebound obtained with 24 active elements at 2° tilt.
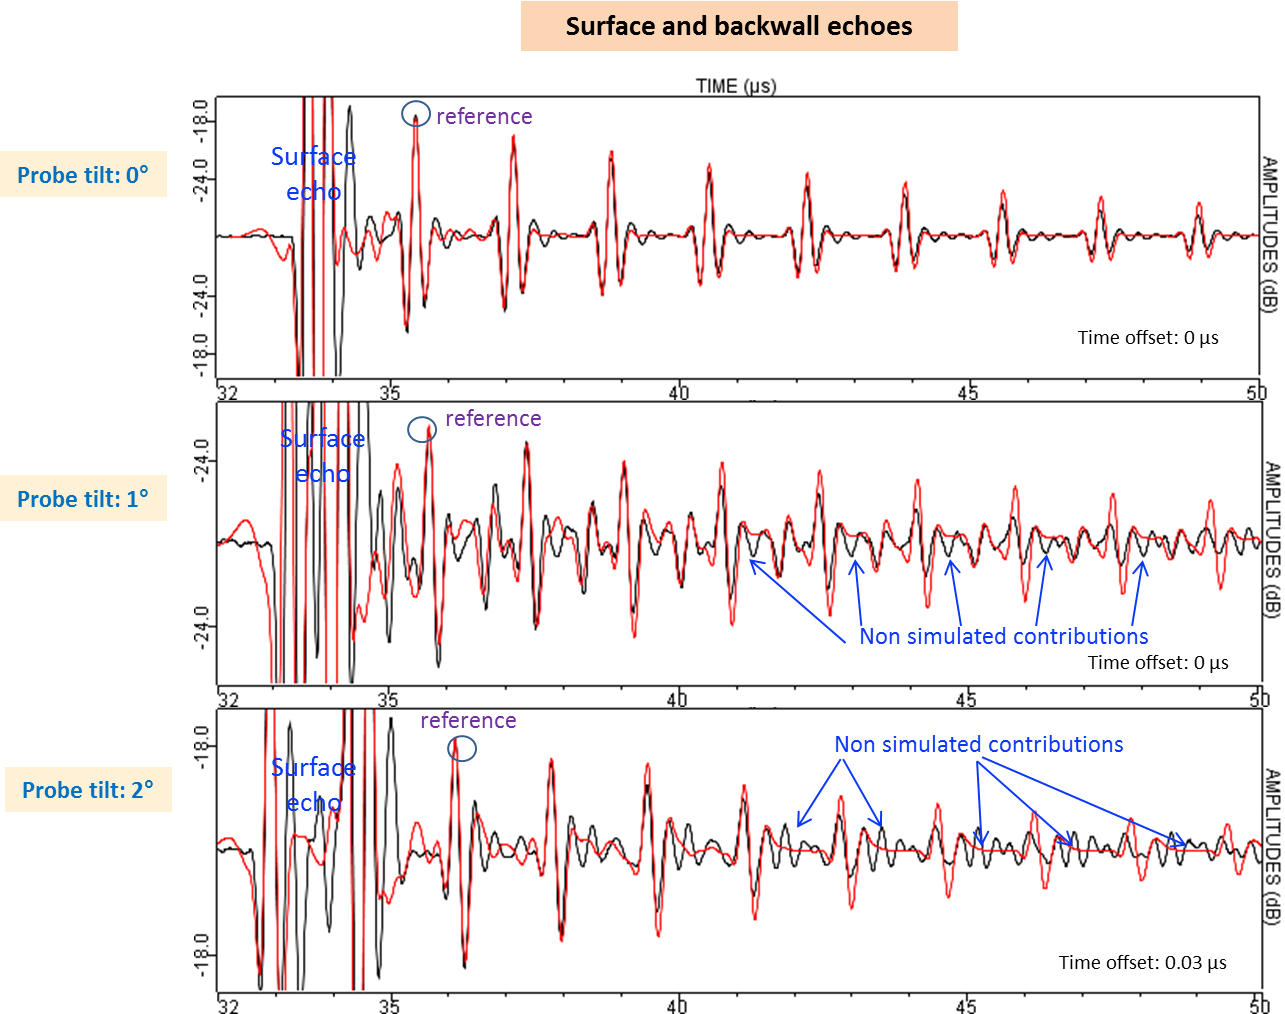
The Ascans are represented here below for the case of 50 mm water path for the surface echo and two measured backwall echoes. The red curve corresponds to the Kirchhoff model, the blue one to the specular model and the black one to measurements.
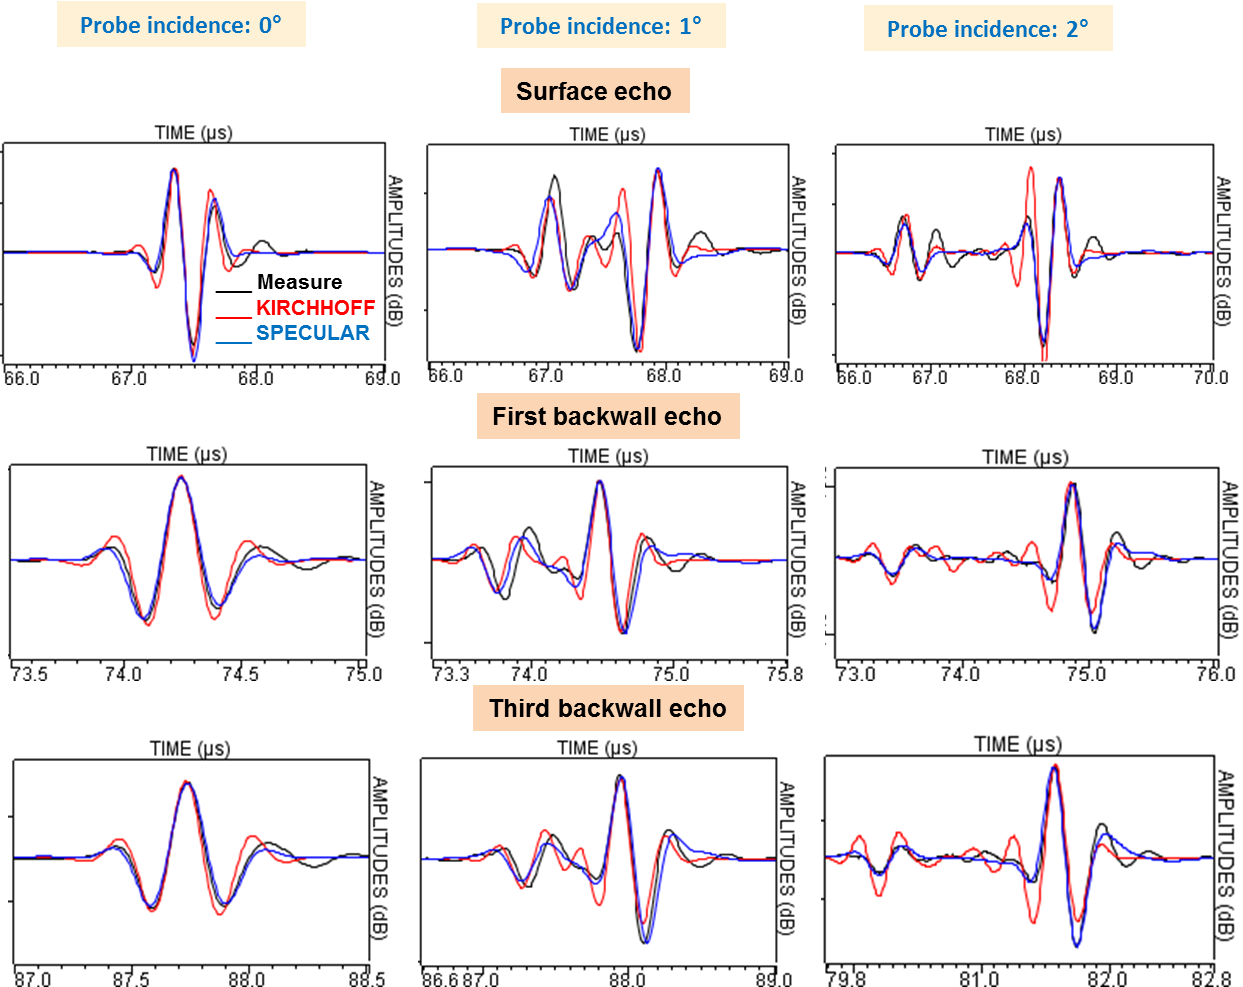
Backwall echoe Ascans obtained with the specular model are more similar to experimental Ascans than those simulated with the Kirchhoff model.
5 mm thickness block and 25 mm water path
Results are calibrated from a Ø6 mm SDH, located at 150 mm depth, a 25 mm water path and a null delay law. Amplitudes of the surface echo (echo n°0), of the first backwall echo (echo n°1) and of the following backwall echoes are plotted below in black for experimental measurements, in red for the Kirchhoff model results and in blue for the specular model results for three angles and three different active elements.
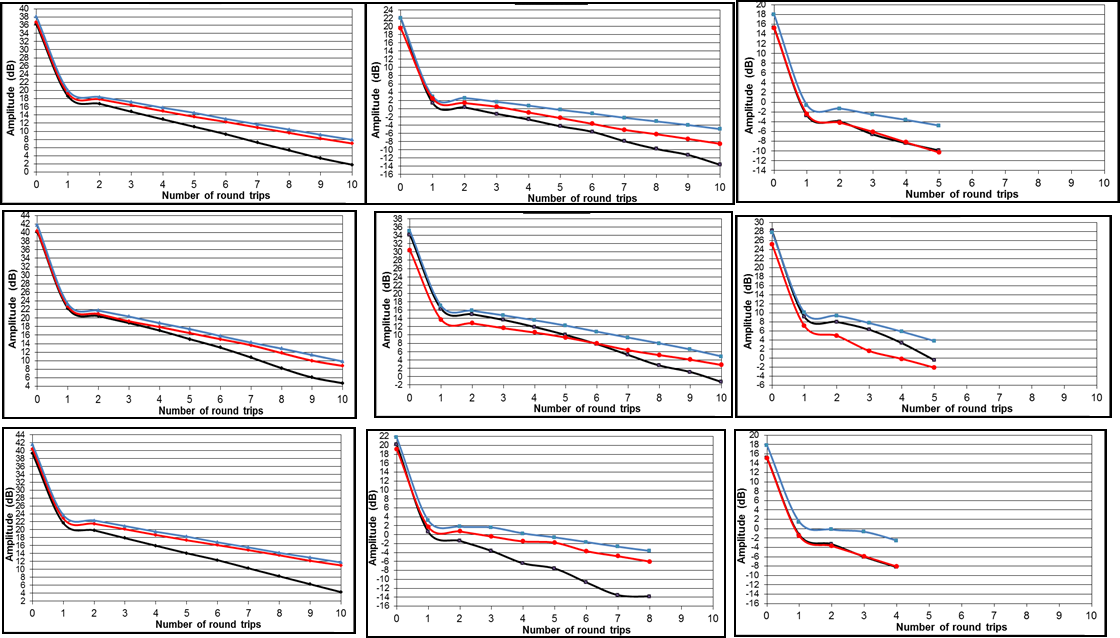
The specular model predicts correctly the amplitude of the surface and first echoe amplitudes, then increasingly overestimates with the increase of the number of elements, the tilt angle and the number of rebounds, reaching 10 dB discrepancies with measurements.
The Kirchhoff model predicts, as well, good results for surface echoes and first backwall echo amplitudes. For the following rebounds, the Kirchhoff model predicts amplitudes that get closer to measurements when the tilt angle increases, for the 16 and 24 elements sequences. For the 8 element sequences, the Kirchhoff model underestimates from 1° tilt, up to 4 dB.
The Ascans are represented here below in the case of a 25 mm water path, three probe’s incidences and for the surface echo and several backwall echoes. The red curve corresponds to specular model and the black one to experiments.
It can be seen, among successive measured backwall echoes, some echoes which amplitudes increase with the probe tilt. These echoes could be due to interferences between elements and are not correctly simulated with the specular model.
Back to SURFACE AND MULTIPLE BACKWALL ECHOES
Back to geometrical echoes