
UT – Phased Arrays – Results obtained with the several depths focusing algorithm
Summary
- Results obtained with the matrix contact probe of 2 MHz with P waves
- P direct echoes amplitude evolution with defect depth
- P waves echodynamic curves Comparison
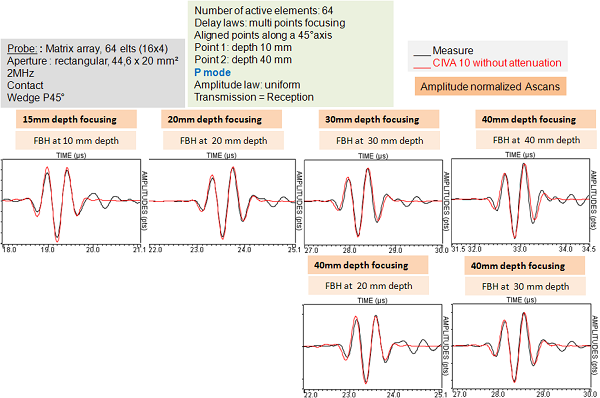
- P waves A-scans comparison
- Comparison of the focal spot width at -3 dB with P waves:
- Results obtained with the 2 MHz matrix contact probe with SV waves
- SV direct echoes amplitude evolution with defect depth
- SV waves echodynamic curves Comparison
- SV waves A-scans Comparison
- Comparison of the focal spot width at -3 dB with SV waves
- Results obtained with the 5 MHz linear contact probe with P waves
- Results obtained with the linear contact probe of 5 MHz with SV waves
- Results obtained with the 10 MHz immersion probe
- P direct echoes amplitude evolution with defect depth
- Echodynamic and A-scans comparisons in P waves
- Comparison of the focal spot width at -6 dB with SV waves
- CONCLUSION
Results obtained with the matrix contact probe of 2 MHz with P waves
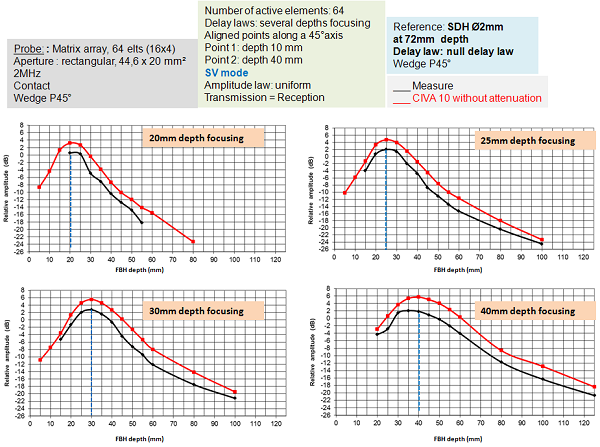
Delay law : several depths focusing algorithm, deflection angle 45°, P waves calculation for delay law, 64 active elements, first focusing point depth: 10 mm, last focusing point depth: 40 mm.
P direct echoes amplitude evolution with defect depth
The figure below allows to compare the experimental and simulated SDHs Ø2 mm amplitude evolution in function of the depth. It allows also to compare the desired focusing point with the one measured in experiments.
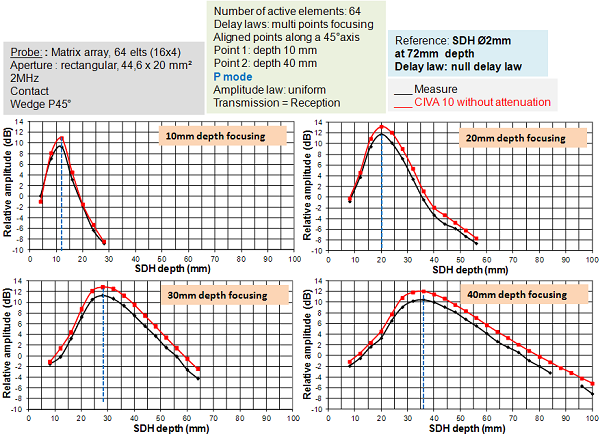
Ø2 mm SDH amplitude comparison experiment / CIVA, P direct mode
There is a good agreement between the two curves (differences lower than 2 dB) and it can be verified that for focal depths smaller than 30 mm, there is a good agreement between the focusing point entered in CIVA for delay law calculation and the experimental focusing point. Differences, up to 5 mm occur when the desired focusing point is beyond the near field calculation limit.
This leads to the same conclusions with the results obtained on Ø3 mm FBHs.
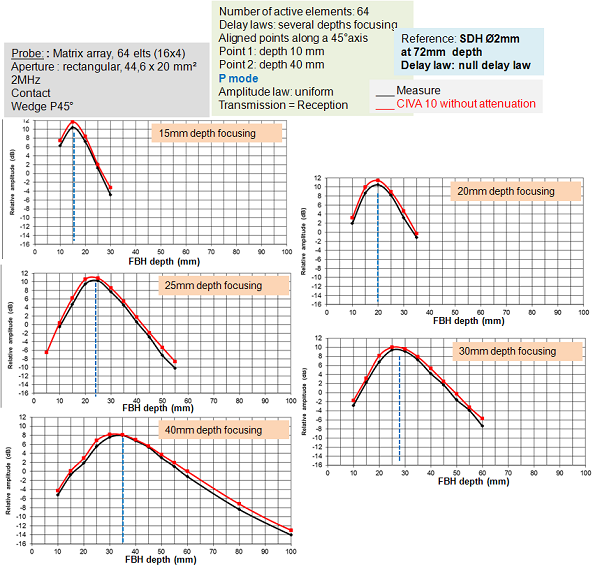
Ø3 mm FBH amplitude comparison, experiment / CIVA, P direct mode
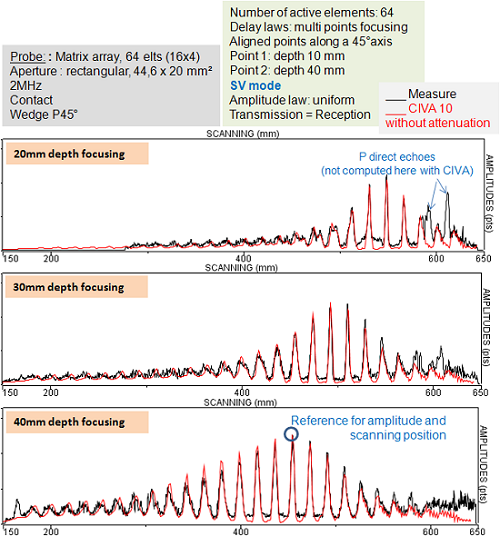
P waves echodynamic curves Comparison
The figure below allows to compare the experimental and simulated echodynamic curves obtained with Ø2 mm SDHs. There is a good agreement between the two curves.
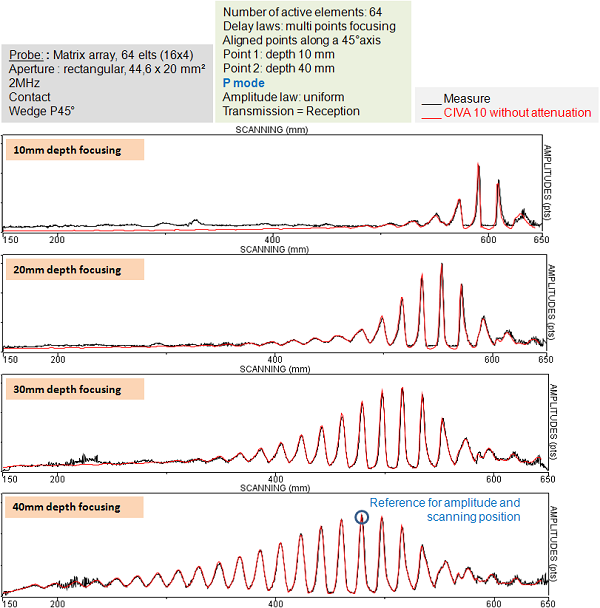
Ø2 mm SDH amplitude comparison, experiment / CIVA, P direct mode
This leads to the same conclusions with the results obtained on Ø3 mm FBHs.
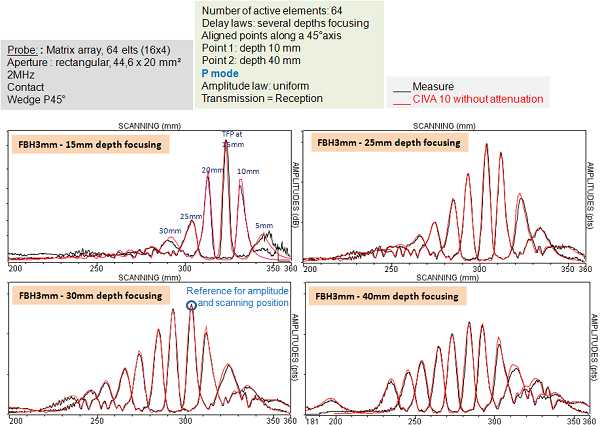
Ø3 mm FBH amplitude comparison, experiment / CIVA, P direct mode
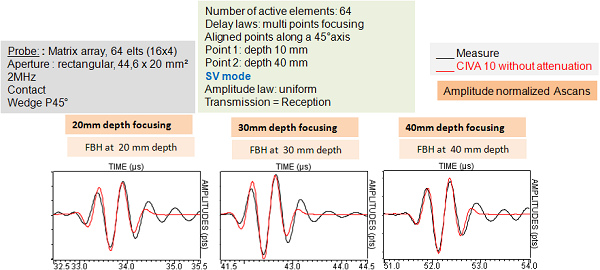
P waves A-scans comparison
Whatever the defect type (SDHs or FBHs), there is a good agreement between simulated and experimental Ascans.
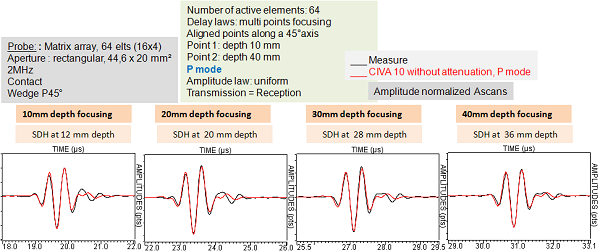
Left: Ø2 mm SDH Ascan comparison, experiment / CIVA, P direct mode
Right: Ø2 mm FBH Ascan comparison, experiment / CIVA, P direct mode
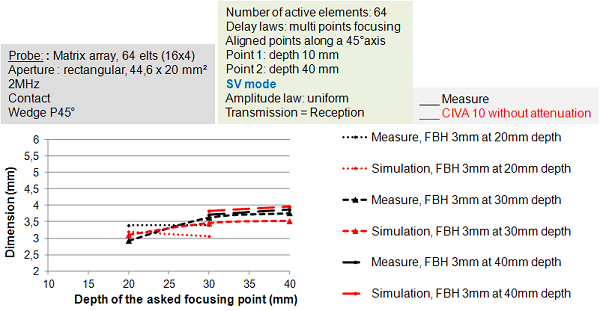
Comparison of the focal spot width at -3 dB with P waves:
Focal spot widths measurements are performed at -3 dB on Ø3 mm FBHs echodynamic curves. Experimental results are in good agreement with the simulated widths (cf. figure below).
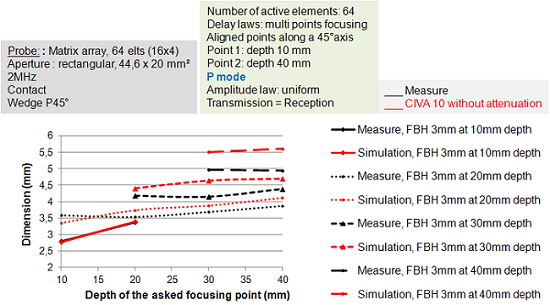
Focal spot width comparison (experiment/CIVA) from P direct echoes of Ø3 mm FBHs
Results obtained with the 2 MHz matrix contact probe with SV waves
Delay law : several depths focusing algorithm, deflection angle 45°, SV waves calculation for delay law, 64 active elements, first focusing point depth: 10 mm, last focusing point depth: 40 mm.
SV direct echoes amplitude evolution with defect depth
Overall and whatever the defect type (SDHs or FBHs), the direct SV echoes amplitude evolution is well predicted by CIVA. Simulated amplitudes are more important than the one measured experimentally (+2 to +4 dB) but as the experimental uncertainty reaches 3 dB, the results are still satisfactory.
It can be seen that there is a good agreement between experimental and desired focusing points (20 mm to 40 mm) because they are always included in the near field of the probe in SV waves.
left: Ø2 mm SDH amplitude comparison, experiment / CIVA, SV direct mode
right: Ø3 mm FBH amplitude comparison, experiment / CIVA, SV direct mode
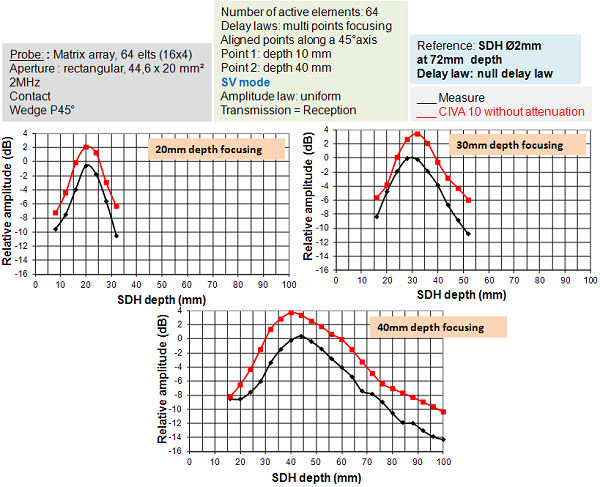
SV waves echodynamic curves Comparison
The figure below allows to compare the experimental and simulated echodynamic curves obtained with Ø2 mm SDHs. There is a good agreement between the two curves.
Ø2 mm SDH echodynamic curves comparison, SV direct mode
The results obtained with Ø3 mm FBHs lead to the same observation.
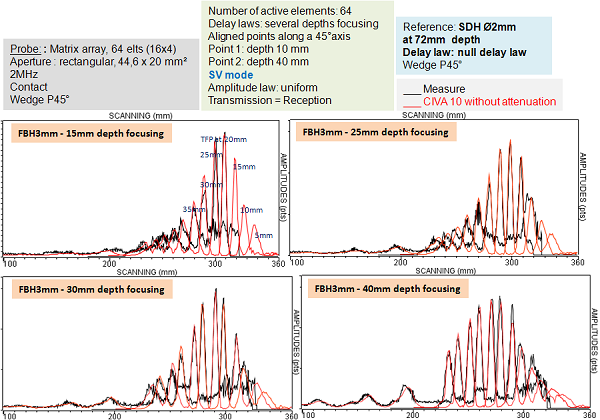
Ø3 mm FBH echodynamic curves comparison, SV direct mode.
SV waves A-scans Comparison
The figure below compares experimental and simulated Ascans of Ø2 mm SDHs. The agreement between the two curves is quite good although the Ascans simulated with CIVA are a little more “high frequency” than the experimental ones. Furthermore, the amplitude of the creeping wave is overestimated by CIVA.
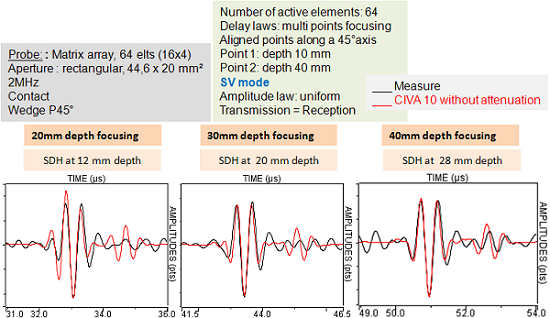
Ø2 mm SDH Ascans comparison, SV direct mode
The following figure presents the results obtained with the FBHs:
Ø3 mm FBH Ascans comparison, SV direct mode
Comparison of the focal spot width at -3 dB with SV waves
Focal spot widths measurements are performed at -3 dB on Ø3 mm FBHs echodynamic curves. Experimental results are in good agreement with the simulated widths (cf. figure below).
Focal spot width comparison (experiment/CIVA) determined from direct SV echoes from Ø3 mm FBH
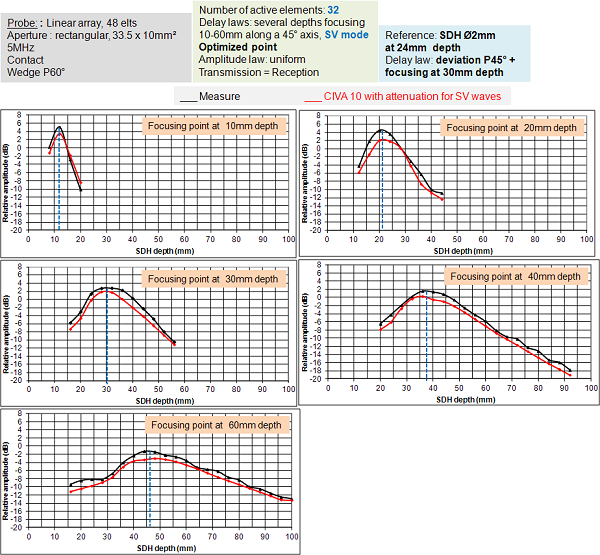
Results obtained with the 5 MHz linear contact probe with P waves
Delay law : several depths focusing algorithm, deflection angle 45°, P waves calculation for delay law, 32 active elements, first focusing point depth: 10 mm, last focusing point depth: 60 mm.
There is a very good agreement between simulation and experiments when comparing direct P waves echoes from Ø2 mm SDHs and from Ø6 mm FBHs. However, discrepancies between experimental and desired focusing point can be noticed when it is beyond 20 mm. This behavior is normal since the near field limit of this probe is 20 mm.
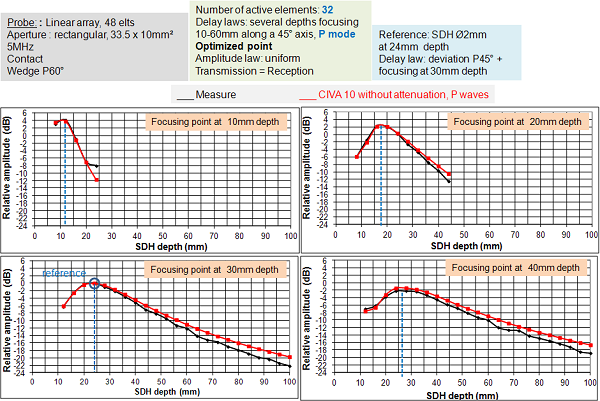
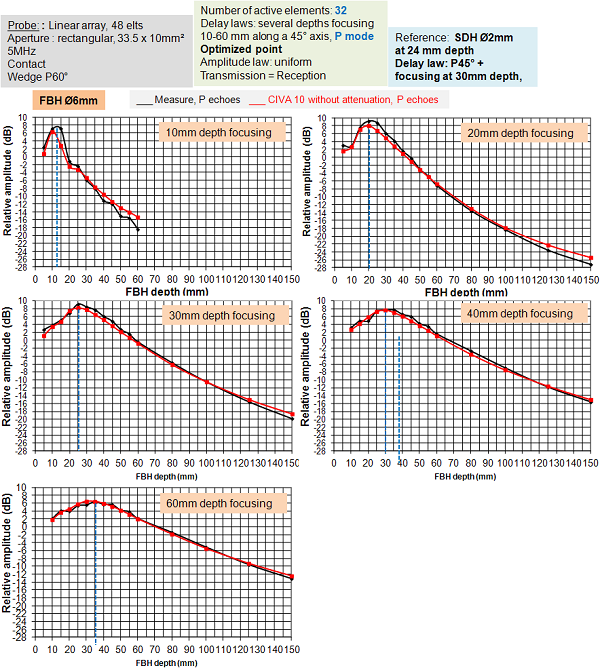
left: Ø2 mm SDH amplitude comparison (experiment/CIVA), P direct mode
right: Ø6 mm FBH amplitude comparison (experiment/CIVA), P direct mode
Results obtained with the linear contact probe of 5 MHz with SV waves
Delay law : several depths focusing algorithm, deflection angle 45°, SV waves calculation for delay law, 32 active elements, first focusing point depth: 5 mm, last focusing point depth: 60 mm.
Whatever the defect type (SDHs or FBHs), the direct SV echoes amplitude evolution is well predicted by CIVA. Simulated amplitudes are lower than the one measured experimentally (-2 to -3 dB) but since the experimental uncertainty reaches 3 dB, the results are stil satisfactory. Beyond 40 mm depth, there are discrepancies between the desired focusing point and the one obtained experimentally. These differences make sense since they are due to the inaccurate beam focusing beyond the near field limit. For SV waves and this probe, this limit is 40 mm depth.
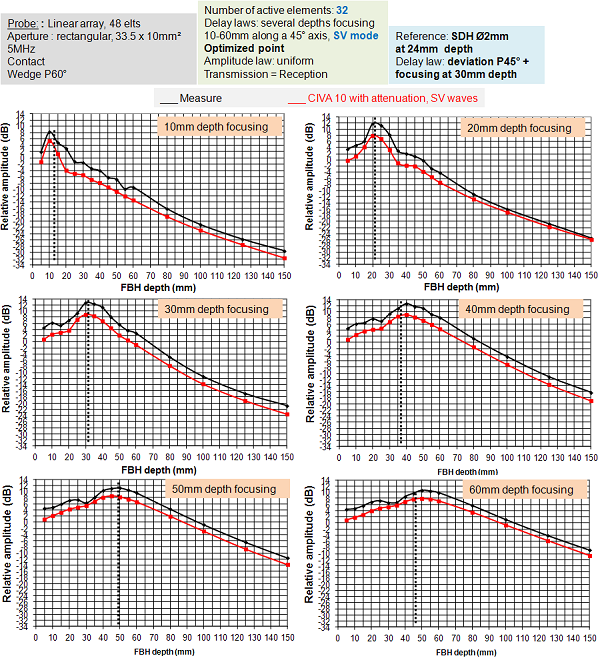
left: Ø2 mm SDH amplitude comparison (experiment/CIVA), SV direct mode
right: Ø6 mm FBH amplitude comparison (experiment/CIVA), SV direct mode
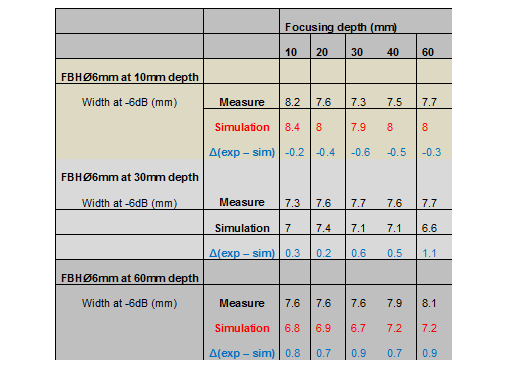
The focal spot width in the plane perpendicular to the inspection plane at -6 dB was measured from the echodynamic curves at the probe position for which maximum amplitude on the FBHs echoes is measured. Experimental and simulated results are in good agreement (cf. table below).
Results obtained with the 10 MHz immersion probe
The water path is 50 mm and the probe is tilted with a 10.24° angle.
Delay law: focal points along the P wave axis, P waves calculation for delay law, 32 active elements, first focusing point depth: 0.1 mm, last focusing point depth: 30 mm.
P direct echoes amplitude evolution with defect depth
The figure below compares the simulated amplitude curves (attenuation law with exponent 2) with the Ø3 mm FBHs experimental amplitude curves. There is a good agreement between the two curves which show discrepancies below or equal to 2 dB.
Moreover, it is normal to observe important differences between the desired and the simulated focusing points. Indeed, the near field limit in P waves is 10 mm for this probe. Then, differences observed for focusing points beyond this limit is not surprising.
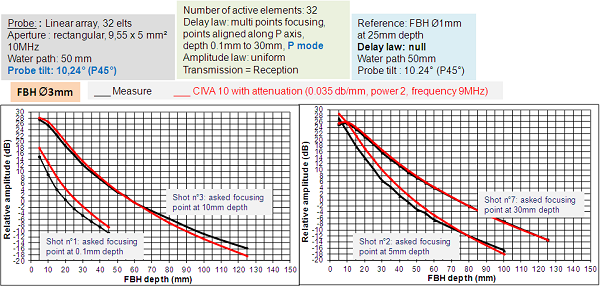
Ø6 mm FBH amplitude comparison (experiment/CIVA), P direct mode
The results obtained with SDHs are also in good agreement.
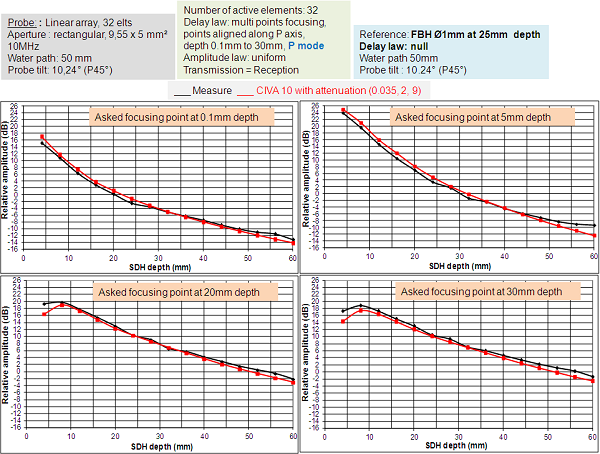
Ø2 mm SDH amplitude comparison (experiment / CIVA), P direct mode
Echodynamic and A-scans comparisons in P waves
The figure below shows the comparison of simulated and experimental Ø2 mm SDHs echodynamic curves. There is a good agreement between the two curves except when the focusing point is located very close to the surface.
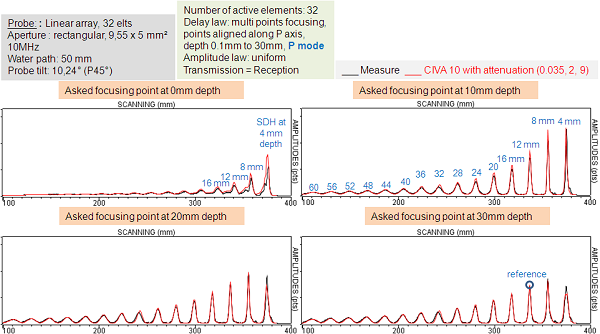
Ø2 mm SDH echodynamic curves comparison (experiment / CIVA), P direct mode
This observation is also available when looking at the echodynamic curves and at the Ascans obtained with the Ø3 mm FBHs (figures below). The simulated curves do not match precisely the experimental ones when focusing is performed close to the surface (0 mm to 10 mm).
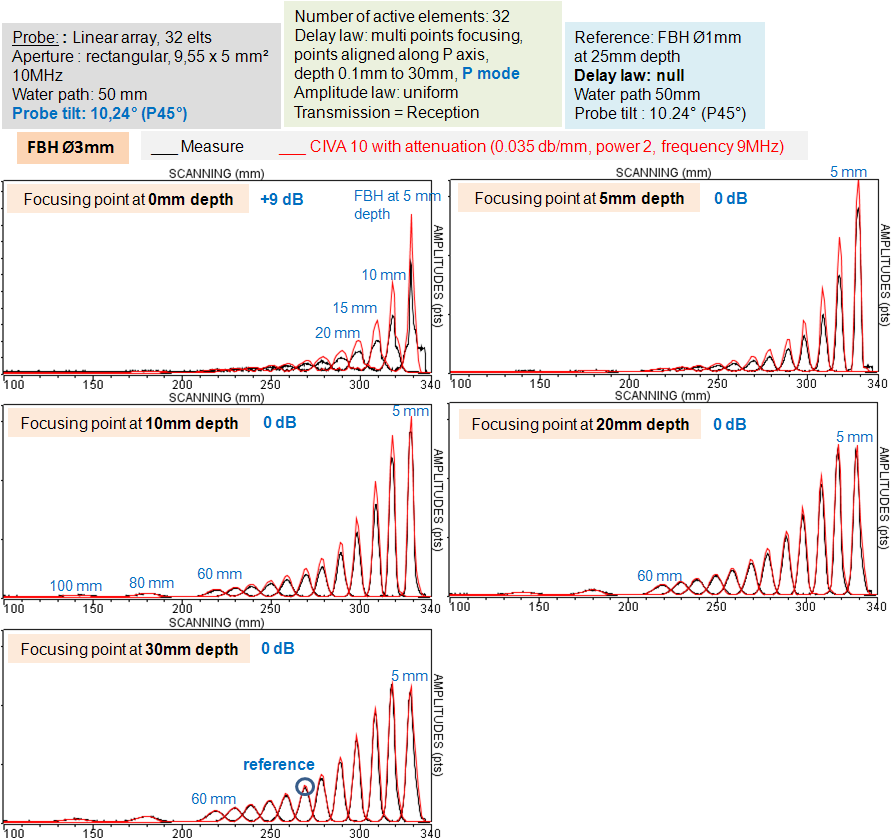
Ø3 mm FBH echodynamic curves comparison (experiment/CIVA), P direct mode
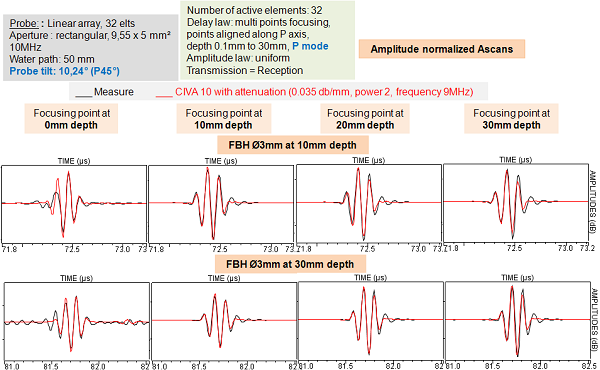
Ø2 mm SDH Ascans comparison (experiment/CIVA), P direct mode
Comparison of the focal spot width at -6 dB with SV waves
The focal spot widths are measured at -6 dB on Ø3 mm FBHs echodynamic curves. Experimental measurements are in good agreement with simulated widths (cf. figure below).
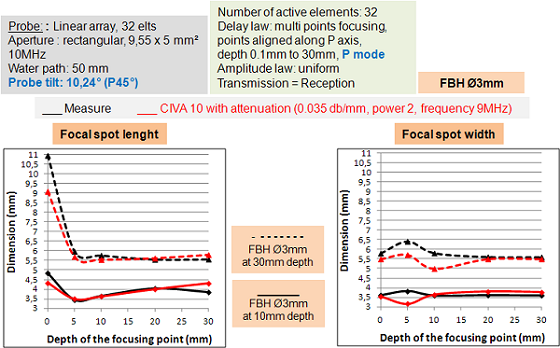
Focal spot width comparison of Ø3 mm FBH, P direct mode
CONCLUSION
Overall, a good agreement between experiment and simulation with the several depth focusing algorithm and with the three probes. The delay laws calculated with CIVA allow to focus at the desired focusing points. The differences observed between the desired and the experimental focusing point are not due to the delay law calculation but by focusing limits of the probes, i.e. the near field limit. Beyond this limit, or beyond the 2/3 of this limit, focusing cannot be achieved properly at the desired focusing point.
Continue to Results obtained with the sectorial scanning algorithm
Back to Phased arrays