
UT – Comparison SDH – FBH : Amplitude analysis
Summary
MONO-ELEMENT CONTACT probe 2.25 MHZ, Ø6.35 MM
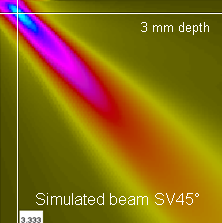
For the Ø6.35 mm contact probe at 2.25 MHz, the SV45° mode is used for inspection. The input signal frequency is 2.25 MHz, with 44% bandwidth and 147° phase.
The acoustic focusing depth is 3 mm, deduced from the simulated beam as illustrated below.
The results are calibrated versus the Ø3 mm FBH at 30 mm depth.
| Measured (dB) | Simulated (dB) | Difference (dB) | |
| FBH Ø3 mm | 0 | 0 | 0 |
| SDH Ø2 mm | -3.1 | -3.5 | 0.4 |
| SDH Ø1.5 mm | -5.0 | -5.8 | 0.8 |
| SDH Ø1 mm | -7.7 | -7.7 | 0 |
MONO-ELEMENT CONTACT probe 2.25 MHZ, Ø12.7 MM, P45°
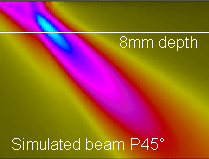
For the Ø12.7 mm contact probe at 2.25 MHz, the P45° mode is used for inspection. The input signal frequency is 2.25 MHz, with 50% bandwidth and 280° phase.
The acoustic focusing depth is 8 mm, deduced from the simulated beam as illustrated below.
The results are calibrated versus the Ø3 mm FBH at 30 mm depth.
| Measured (dB) | Simulated (dB) | Difference (dB) | |
| FBH Ø3 mm | 0 | 0 | 0 |
| SDH Ø2 mm | 2.2 | 2.3 | -0.1 |
| SDH Ø1.5 mm | 1.3 | 1.4 | -0.1 |
| SDH Ø1 mm | 0.3 | -0.6 | 0.9 |
MONO-ELEMENT CONTACT probe 2.25 MHZ, Ø12.7 MM, SV 45°
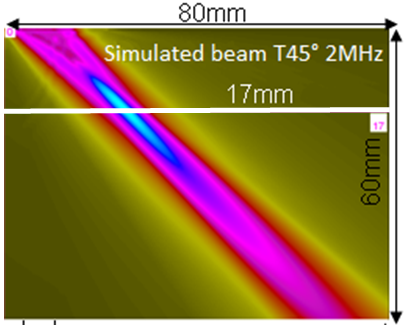
For the Ø12.7 mm contact probe at 2 MHz, the SV45° mode is used for inspection. The input signal is the inverse P45° experimental direct specular echo of a Ø3 mm FBH, tilt 45° at 30 mm depth.
The acoustic focusing depth is 17 mm, deduced from the simulated beam as illustrated below.
The results are calibrated versus the Ø3 mm FBH at 30 mm depth.
| Measured (dB) | Simulated (dB) | Difference(dB) | |
| FBH Ø3 mm | 0 | 0 | 0 |
| SDH Ø2 mm | -2.7 | -2.4 | -0.3 |
| SDH Ø1.5 mm | -3.9 | -4.4 | 0.5 |
| SDH Ø1 mm | -5.6 | -6.6 | 1.0 |
Phased-array CONTACT probe of 20 elements with 0.7 mm ptich
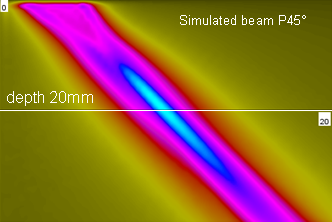
For the phased array contact probe of 20 active elements (out of 48) with 0.7 mm pitch at 5 MHz, the P45° mode is used for inspection. The focal law is a P45° beam steering.
The acoustic focusing depth is 20 mm, deduced from the simulated beam as illustrated below.
The results are calibrated versus the Ø3 mm FBH at 30 mm depth.
| Measured (dB) | Simulated (dB) | Difference (dB) | |
| FBH Ø3 mm | 0 | 0 | 0 |
| SDH Ø2 mm | -3.2 | -2.5 | -0.7 |
| SDH Ø1.5 mm | -4.5 | -3.8 | -0.7 |
| SDH Ø1 mm | -5.8 | -5.3 | -0.5 |
Continue to A-scan analysis
Back to Comparison SDH – FBH
Back to Calibration defects