
Team workshop 15
Experimental protocol
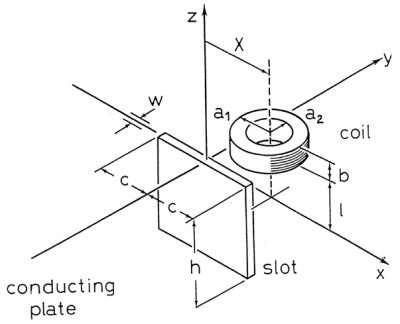
The experimental installation is shown on the figure below. A circular coil move parallel to the x axis along the rectangular defect edge in an aluminium alloy plate. Frequency and lift-off values are fixed. The impedance variation ΔZ is measured as a function of the coil center position.
Experimental protocol
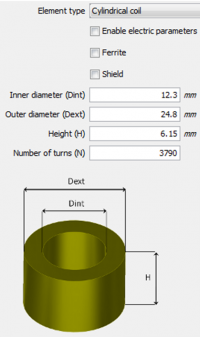
Experimental input data
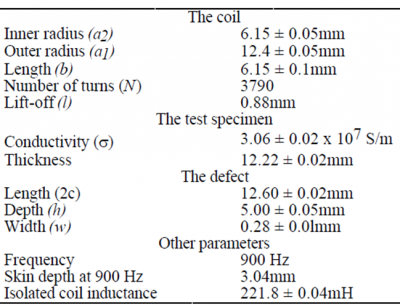
Specimen
The inspected specimen is a thick plate of 12.22 mm thickness, in aluminium, conductivity of 30.6 MS.m-1 and relative permeability of 1.
Thick plate modeled in CIVA
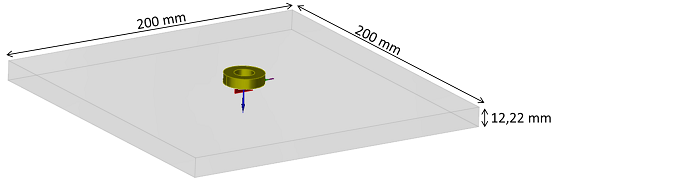
Probe
The probe is made out of a cylindrical coil at double function which geometrical properties are gathered on the figure below that shows the panel in CIVA allowing the definition of those properties. The acquisition is done at 900 kHz, with 1 mA in injection and reception in absolute mode.
Geometrical properties of the probe
Flaw
A non-trough and surface emergent notch is machined in the piece, as shown on figure below.
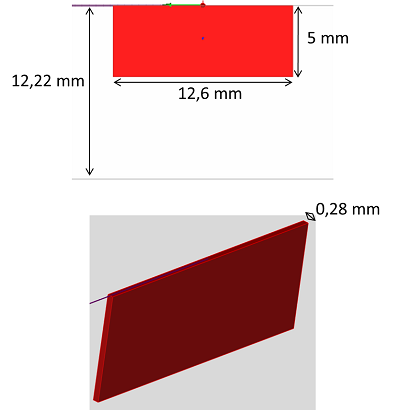
Rectangular flaw
Experiment/simulation comparisons
The experimental measurements have been realized with an impedancemeter, it has also not been necessary to calibrate the results before the comparison.
Lissajous curves have been plotted and amplitudes, phases, real and imaginary parts as a function of the scanning are compared on the figures below. A very good agreement is observed between experiments and simulations.
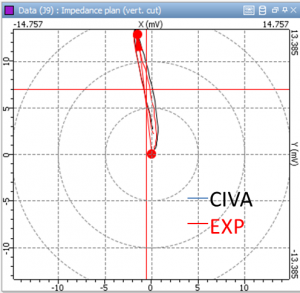
Lissajous curves in impedance plane, vertical cut
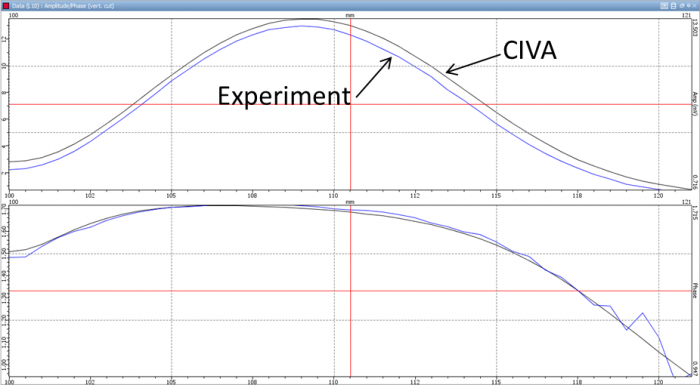
Amplitudes (up) and phases (down) curves comparison
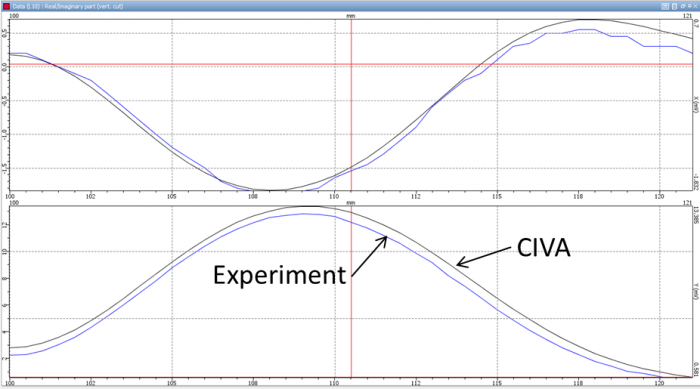
Real (up) and imaginary (down) curves comparison
Finally, the table below gathers ampltudes and phases values and confirms the very low gap between experiment and simulation, less than 1 dB.
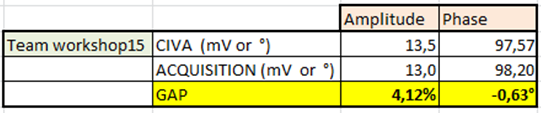
Maximal amplitudes values and corresponding phases, and discrepancies between CIVA and experiment (references: experimental values).
Continue to BENCHMARK COFREND COMMON FUNCTION
Go back to à FLAT SPECIMEN