
UT – Surface Echoes: As machined surface type
A 6.55 mm x 5 mm linear probe, which properties are reminded in the table below, is involved to measure the surface echo on a complex surface which profile is known.
| Ø Crystal (mm) | Mode | Frequency (MHz) | Bandwith (%) | Phase (°) |
|---|---|---|---|---|
| Linear (32 élts) | L0° | 10 | 55 | 290 |
The specimen surface is wavelike, as illustrated below.
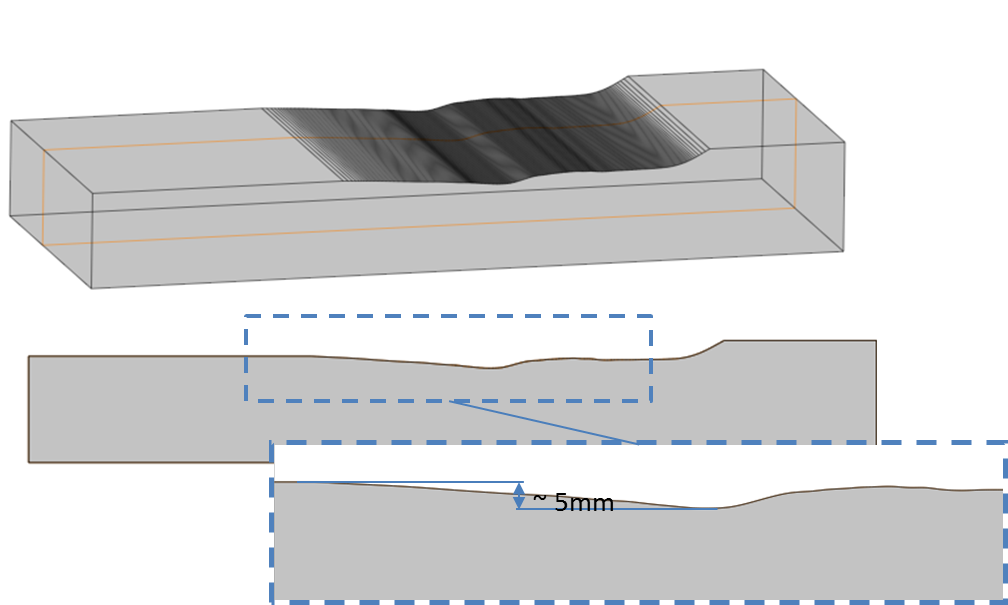
« Beam steering » and « multi-point focusing » laws have been applied to the probe. A mechanical scanning has been carried out on the complex profile keeping a constant probe height relative to the flat part of the specimen.
The profile has been cut up in two different ways: in 325 entities (« accurate » profile) and in 35 entities ”simplified” profile).
In order to evaluate the accuracy effect of the profile description on the simulated surface echo amplitude, two simulations have been carried out for two different descriptions of the profile.
Beam stearing law around L0°
The surface echo has been measured for beam stearing from 0° to 10°, by 2 mm steps, for a 50 mm water path and 32 active elements. The figure below shows radiated fields examples.
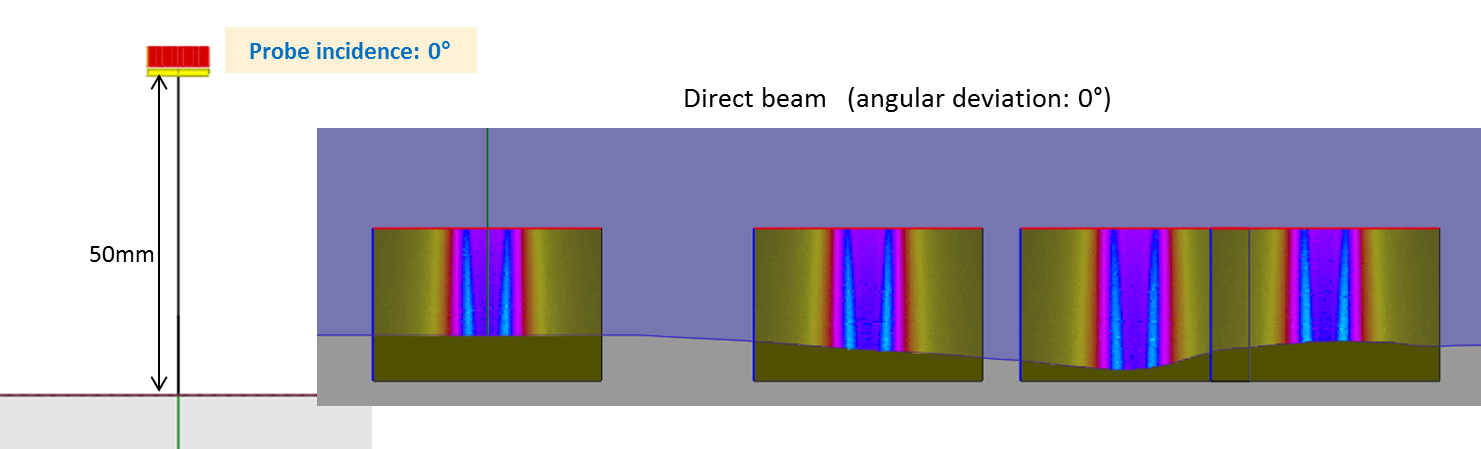
All following results have been calibrated from a surface echo for null delay law and 50 mm water path.
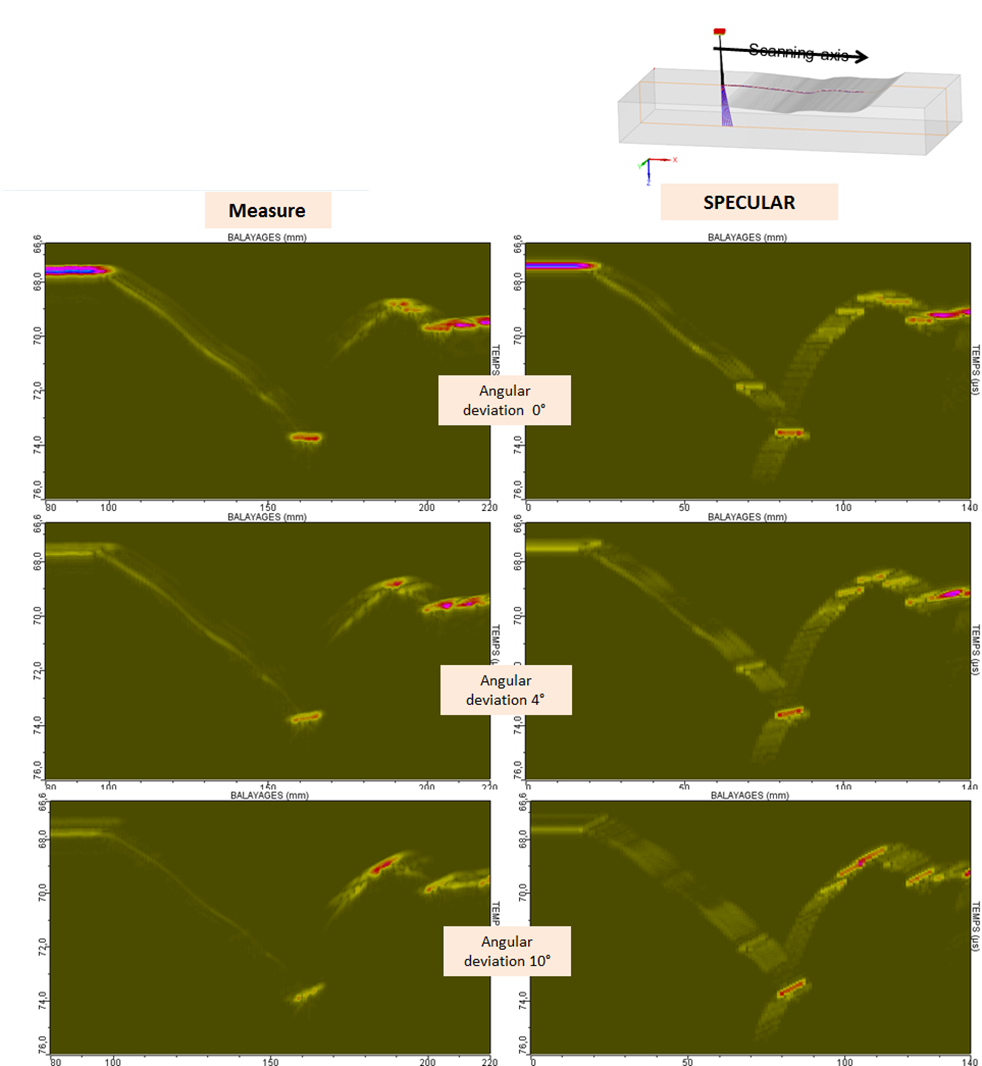
Initially, amplitudes as a function of scanning are compared between both CIVA models and measurements only for the « accurate » profile. Secondly, « simplified » and « accurate » profiles with specular model are compared to measured results.
Comparison of Kirchhoff and specular models with measurements for the « accurate » profile.
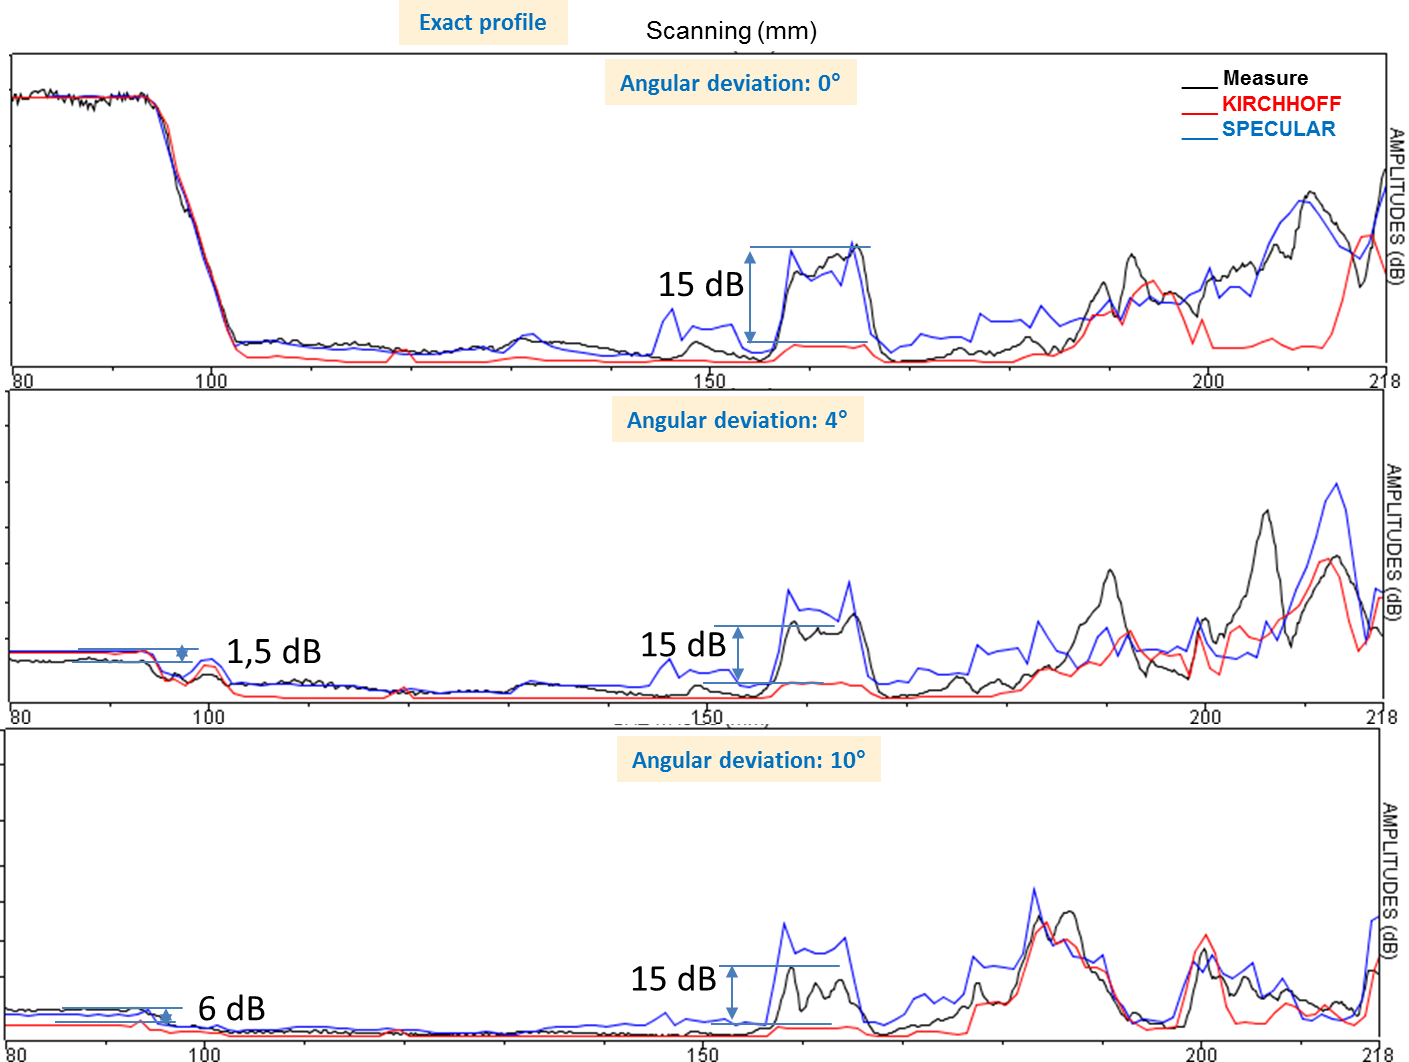
Kirchhoff model presents a good agreement with measurements only on the flat part of the profile for beam steering from 0° to 4°. For 10°, the gap reaches 6dB and on the complex profile, the maximal gap reaches 15 dB when the probe is located on the « basin » regardless of the angular deflection. On the other hand, specular model predicts quite accurately amplitudes with at maximum 4dB difference for the greater beam steering (10°). This comparison clearly shows the improvement brought by the specular model.
« Accurate » and « simplified » profile comparisons with measurements for specular model.
Now that it has been shown that specular model provides better results in the case of a complex surface, the accuracy of the geometrical profile description is evaluated here. In the following echodynamic curves, « simplified », « accurate » profiles and measurement amplitudes are compared in the case of specular model for beam steering of 0°, 2°, 4°, 6°, 8° and 10°.
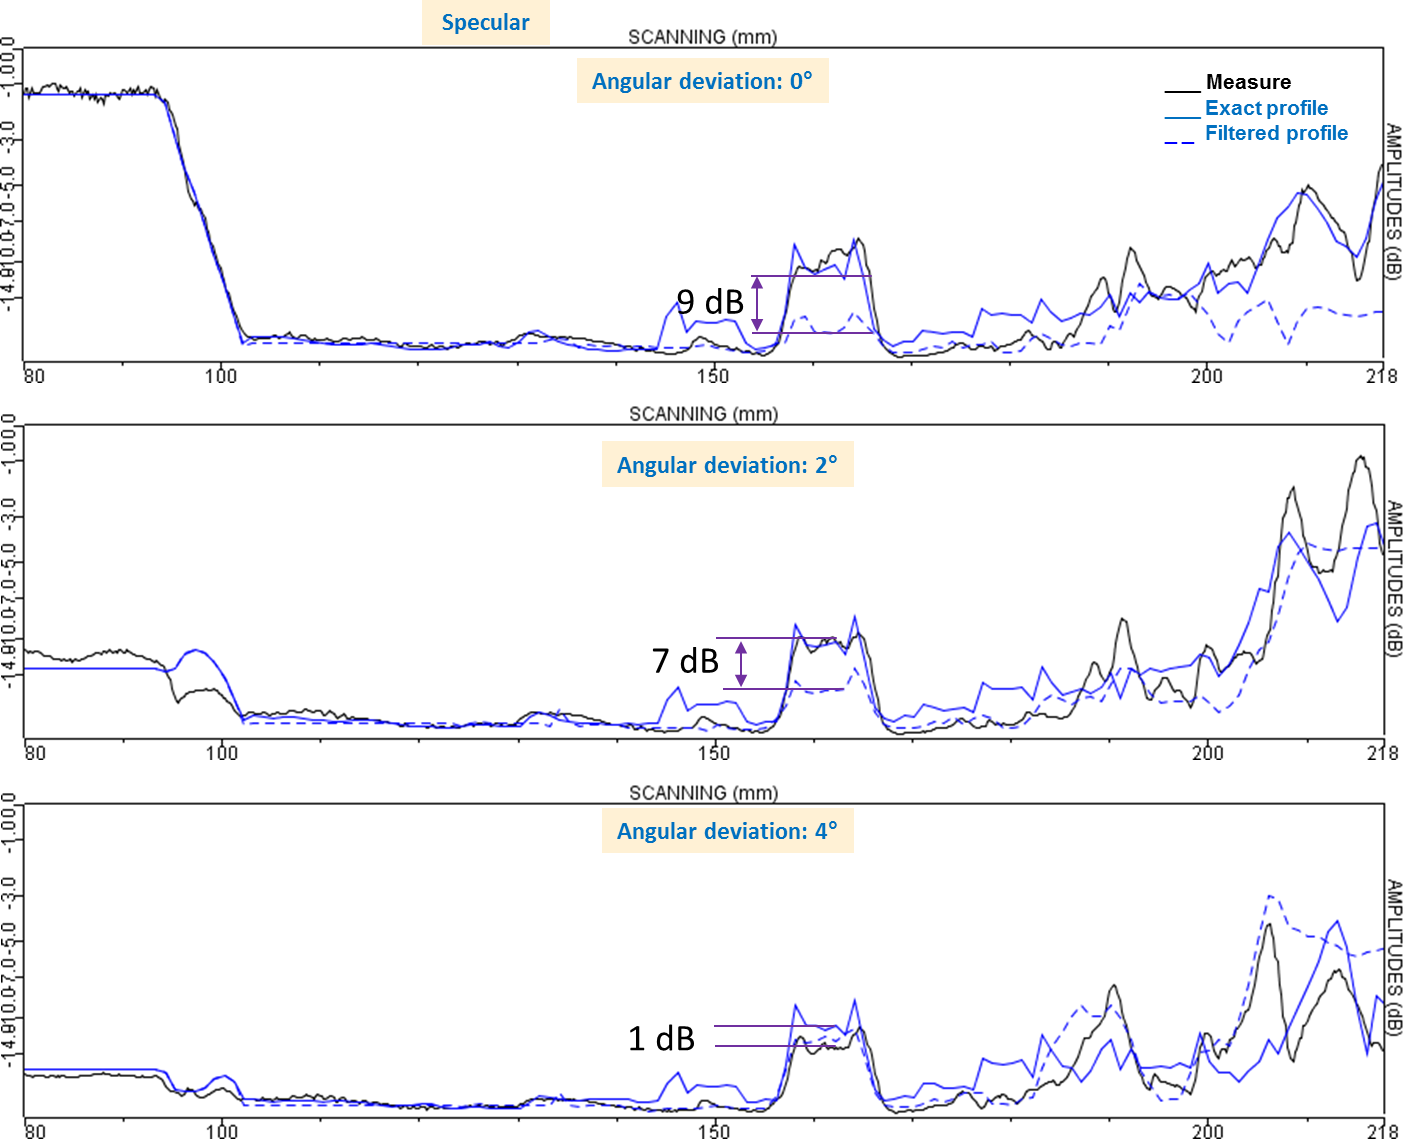
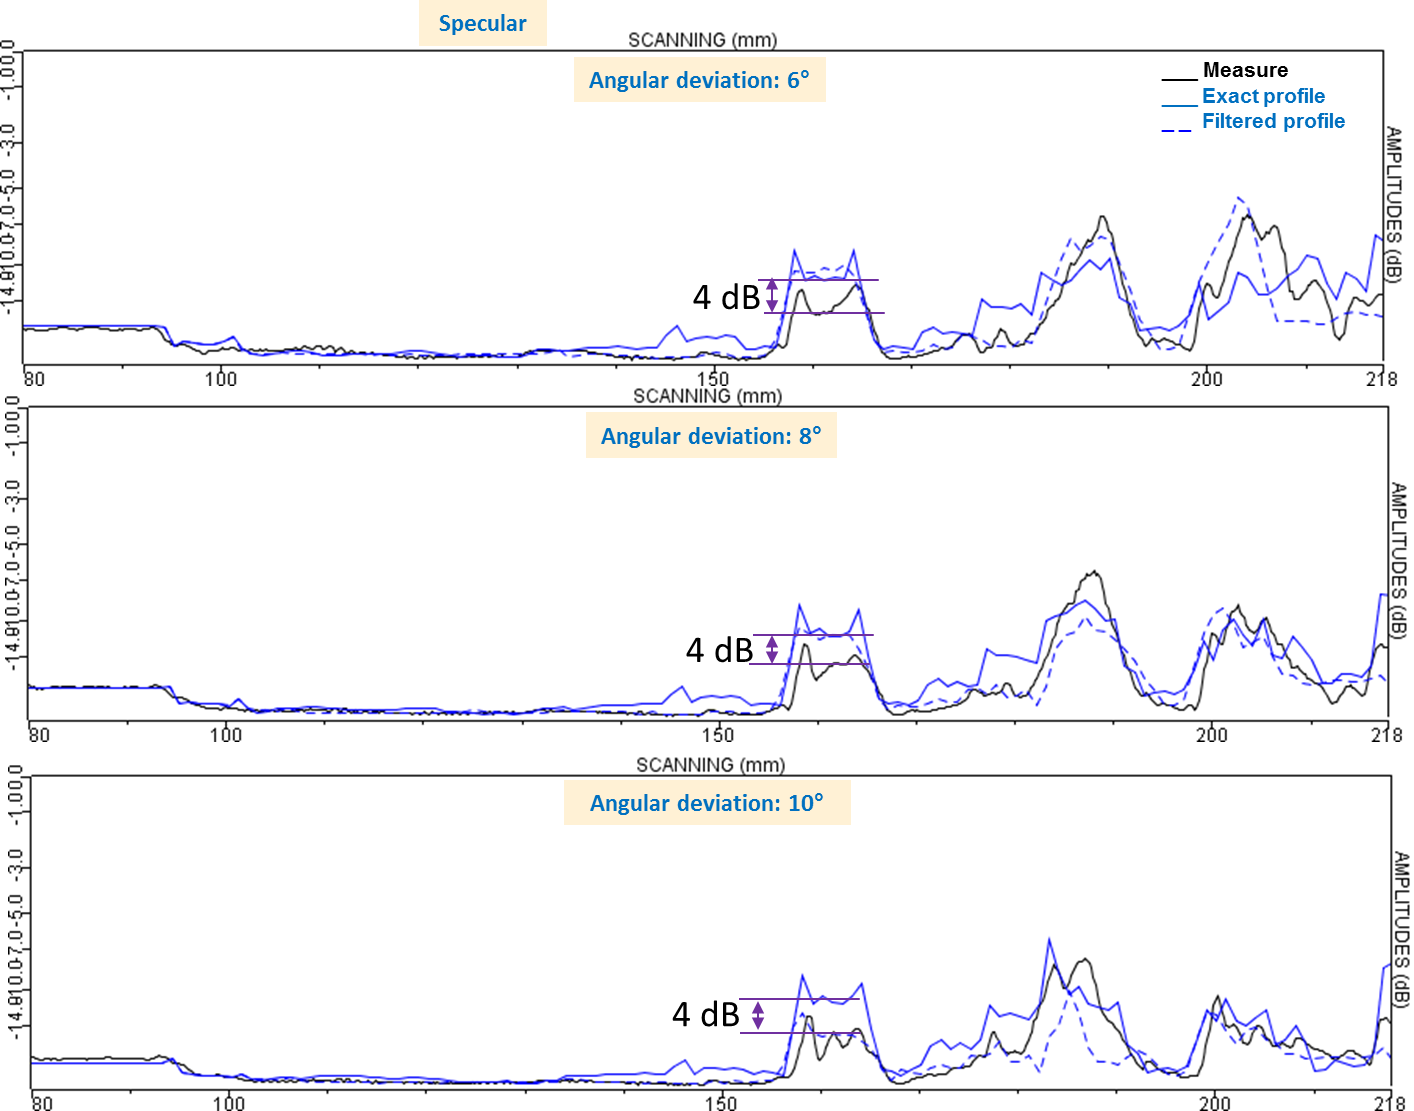
Results obtained with the « accurate » profile seem to be slightly closer to measurements for 0° and 2° beam steering, but generally both descriptions provide amplitudes quite similar and close to the measured results. It is difficult to determine the most relevant profile.
Ascans comparison between the « accurate » profile of specular model and the measures.
For three positions on the block surface, noted 1, 2 and 3, respectively corresponding to the flat surface, to the slope and to the « basin » of the piece; specular and « accurate » profile Ascans are compared to measured Ascans.
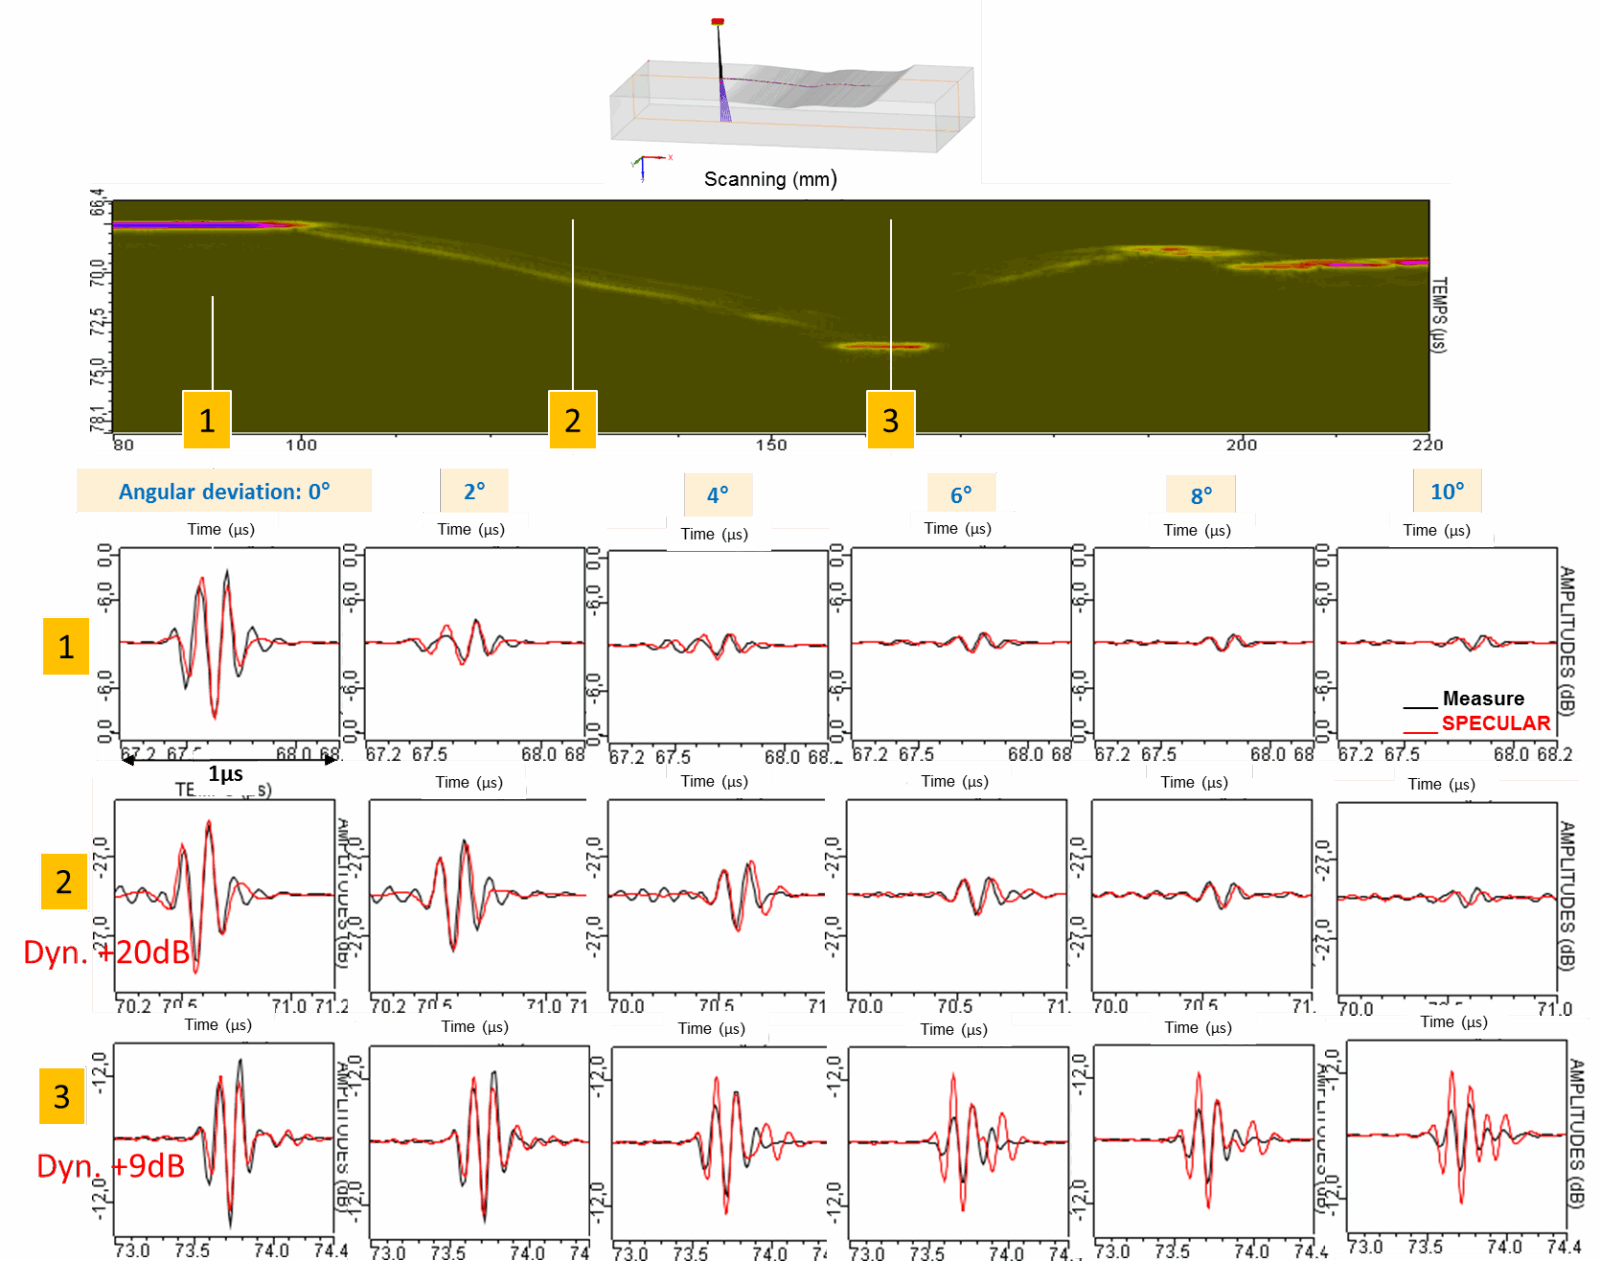
For the flat and slope parts (positions 1 and 2), the specular model predicts correctly the amplitudes, for the « basin » part (position 3), the agreement is not so good.
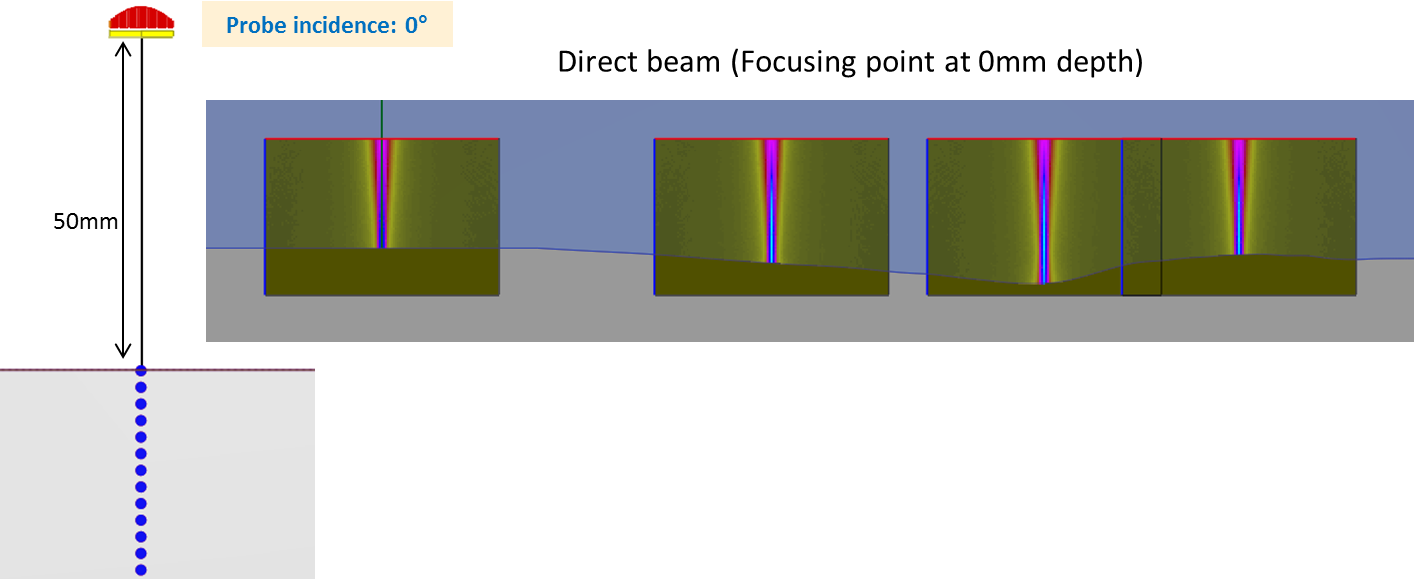
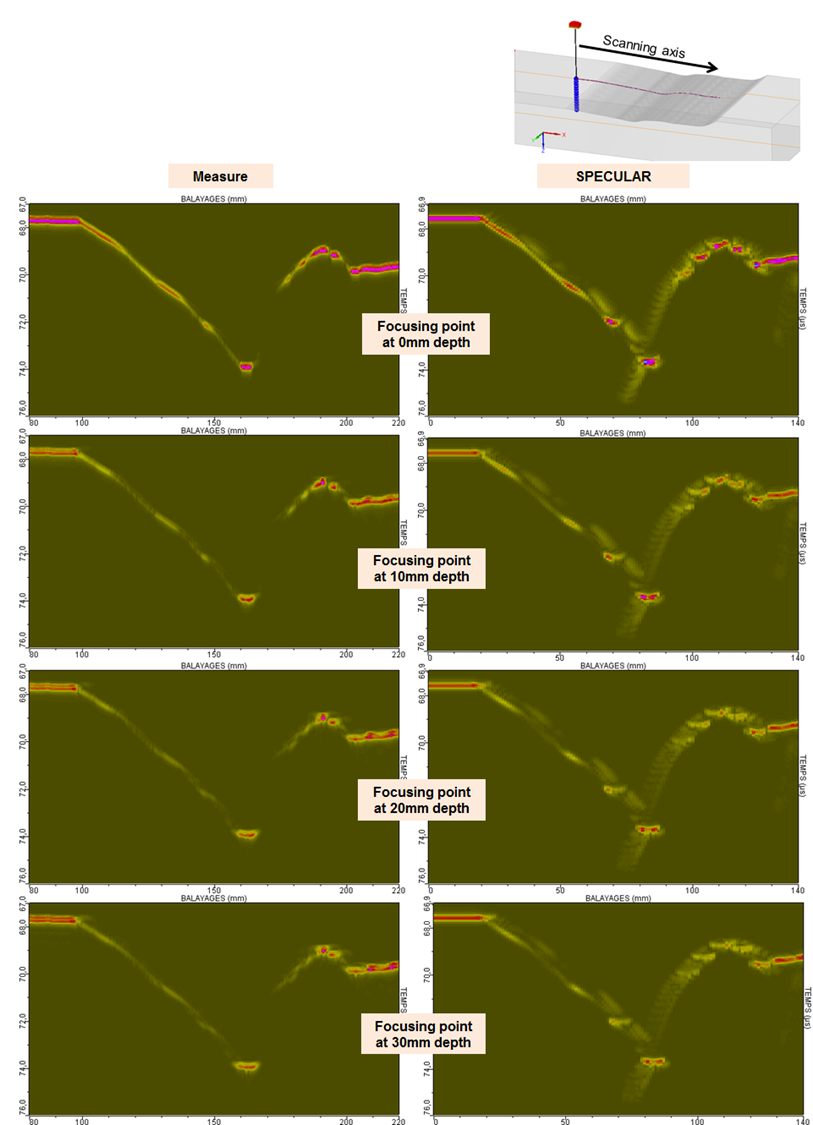
Focal laws in different points
The surface echo has been measured for focal laws in different points located along the L0° axis at depths from 0.1 mm to 30 mm in 2.5 mm steps, from the surface. The probe water path is equal to 50 mm and all 32 elements are active. Radiated fields examples are presented here below.
In this study, only specular model results are compared to measured results.
Comparison of «Accurate » and « simplified » profiles in specular model with measurements
Following results are calibrated on a surface echo with a null focal law and 50 mm water path.
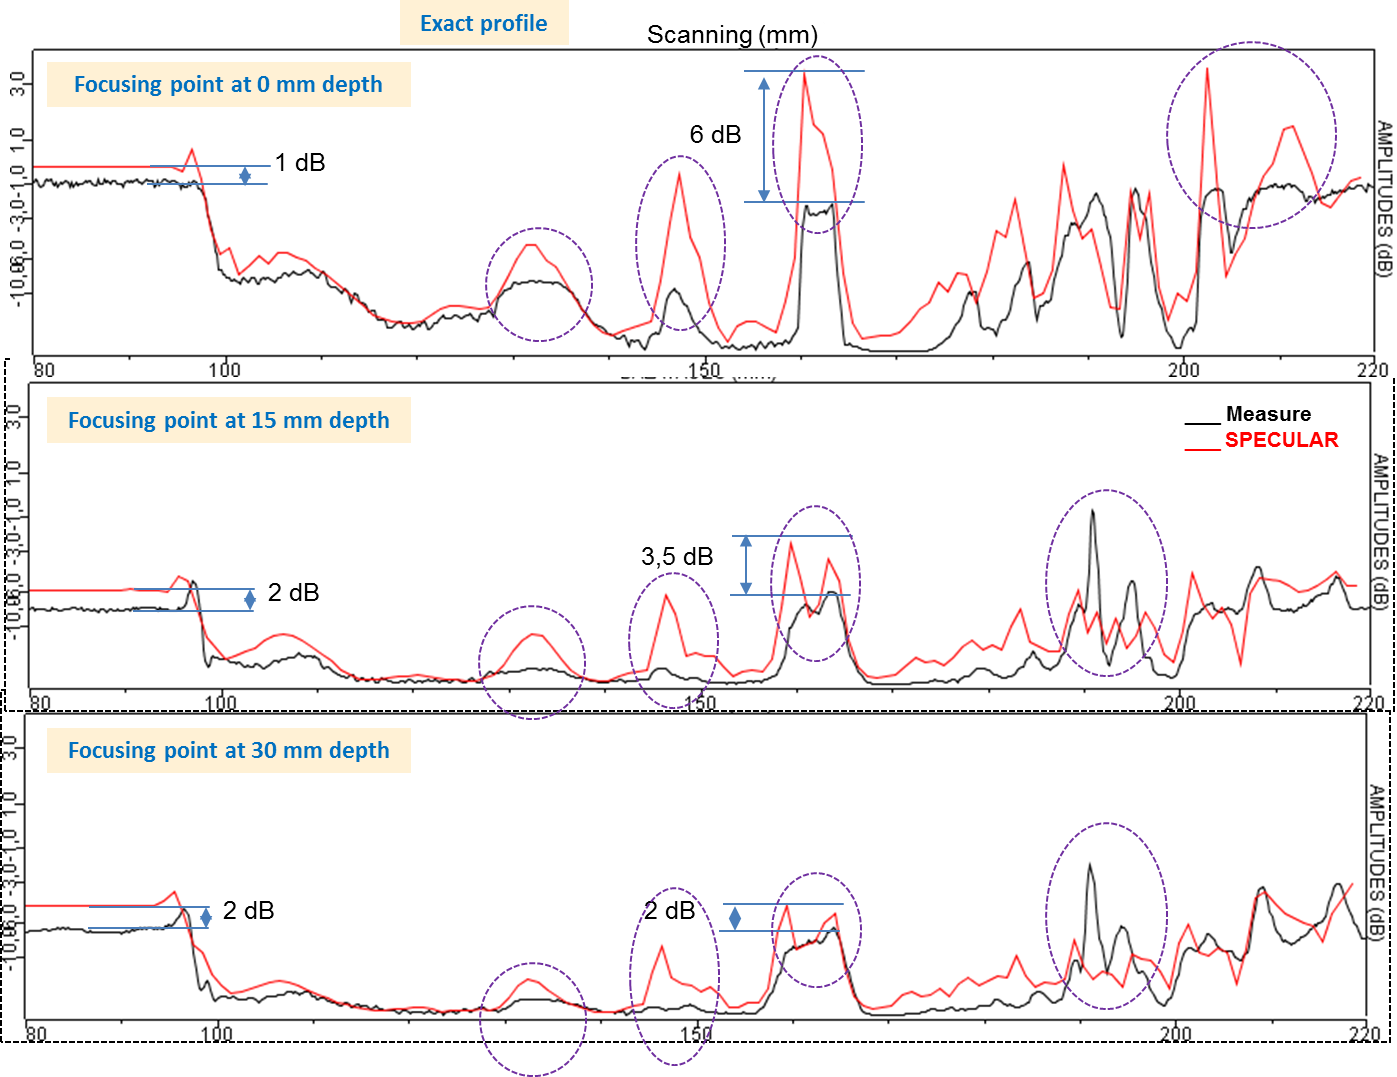
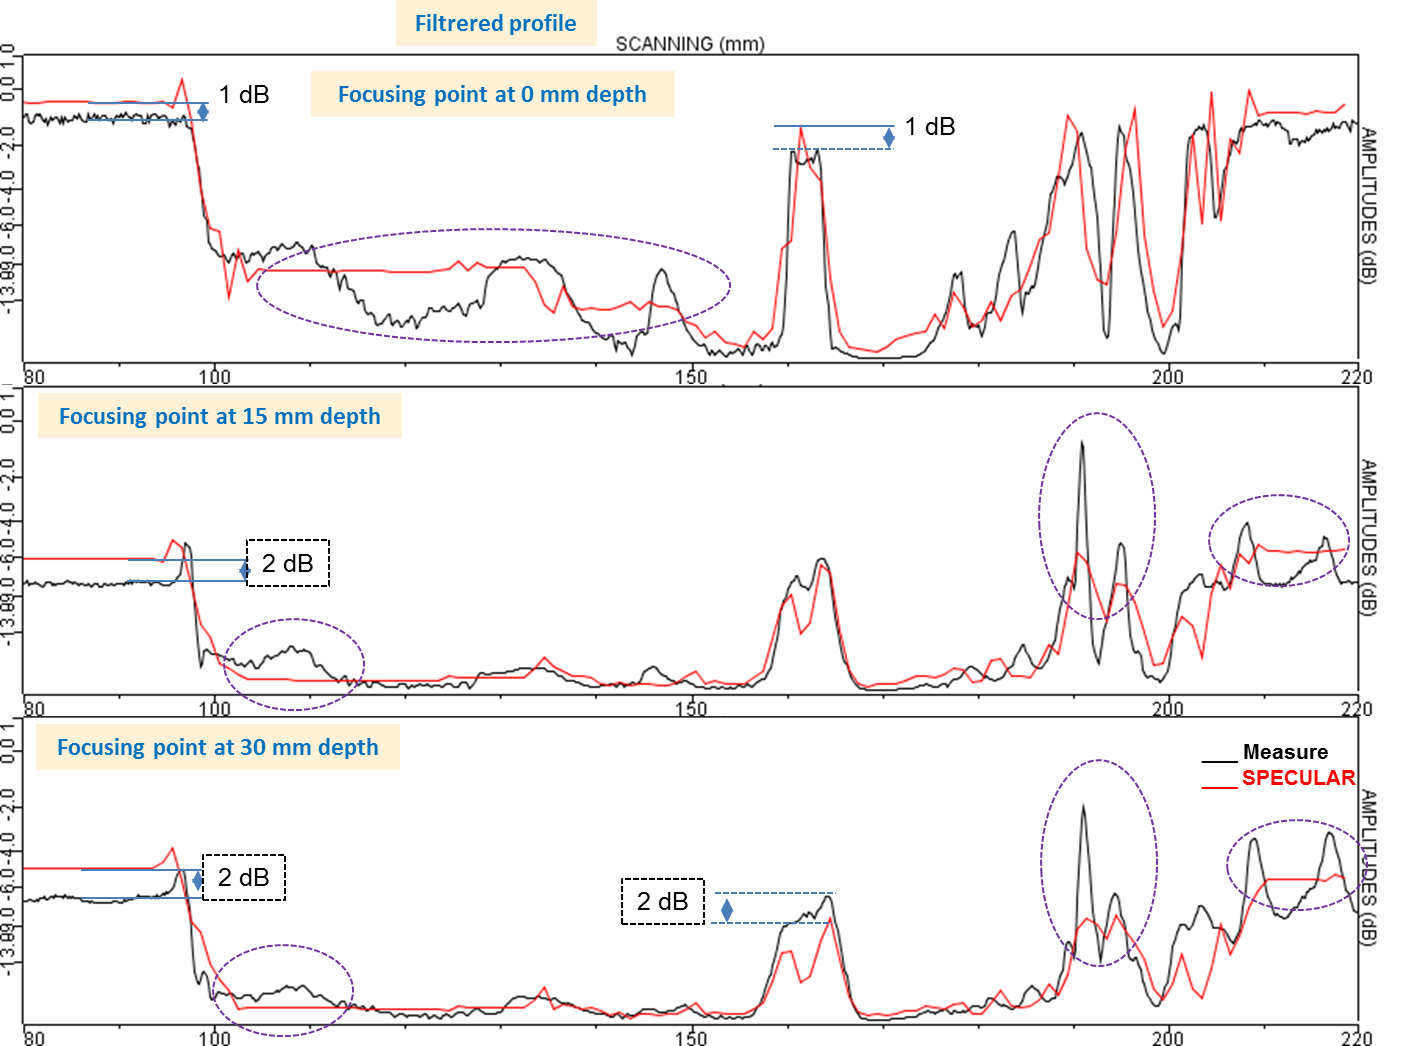
Discrepancies between simulation and measurements greater than 2 dB are circled in violet on the graphs above. The maximum discrepancy reaches 6 dB for the exact surface profile. But as previously, both models are close to each other, predicting quite good results compared to measurements. It is not evident to determine the most relevant profile because differences from measured results don’t appear for the same probe positions.
Ascans comparison of « accurate » and « simplified » profiles in specular model with measurements
As previously, for the 3 surface positions on the specimen, called 1, 2 and 3, and which correspond respectively to the planar part, the slope and the “basin” of the specimen, the Ascans with “accurate” profile and specular model are compared to experimental Ascans.
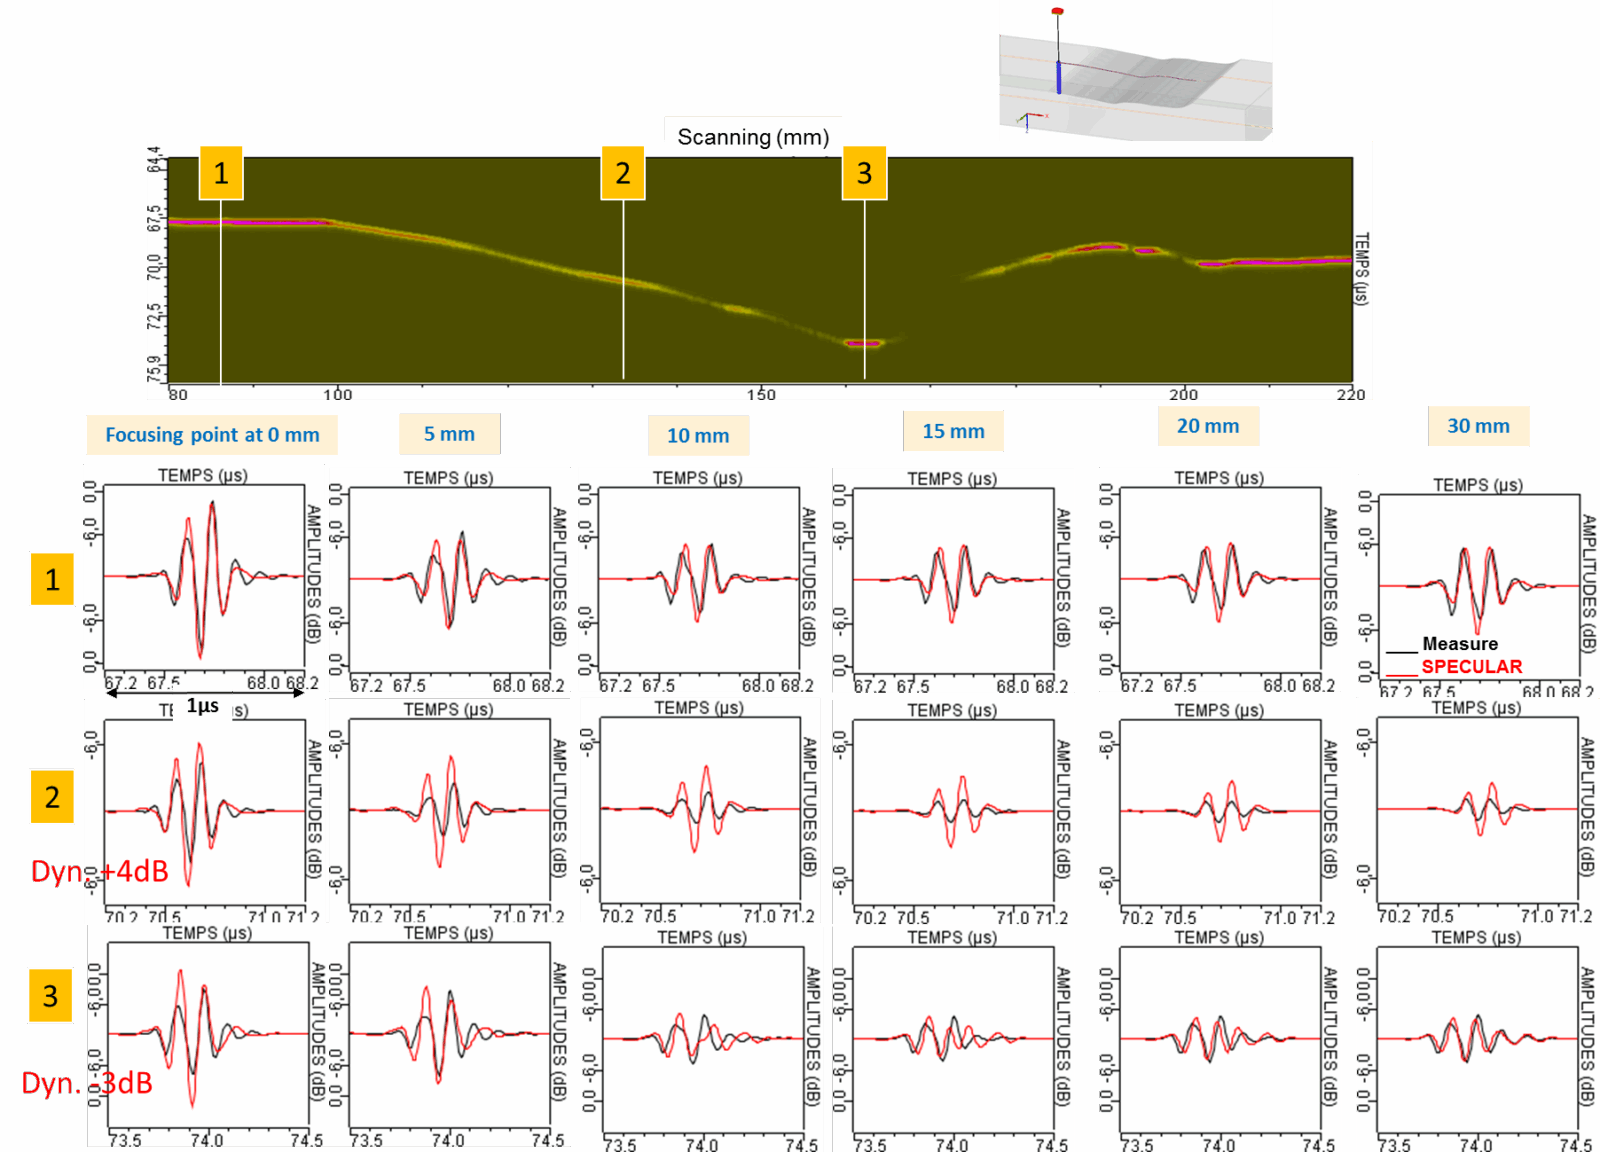
Globally, the three positions present a good agreement with measurements.
Continue to Weld bead surface type
Back to Surface echoes
Back to Geometrical echoes