
Tube inspection with a rotating probe
Summary
Specimen
A tube made in inconel (conductivity of 1 MS.m-1 and a relative permeability of 1) is inspected with a rotating probe. The tube has an external diameter of 18.99 mm, an internal radius of 8.32 mm, a thickness of 1.175 mm and measures 50 mm length.
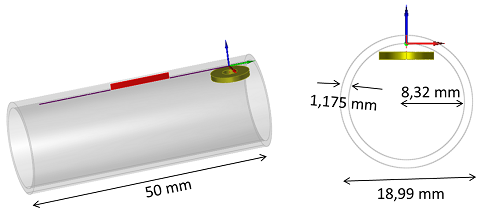
Inconel tube inspected with a rotating probe
Probe
The probe is a cylindrical coil which geometrical characteristics are defined on the following figure. The acquisition is carried out in an absolute mode at 5 different frequencies: 25, 50, 100, 150 and 200 kHz.
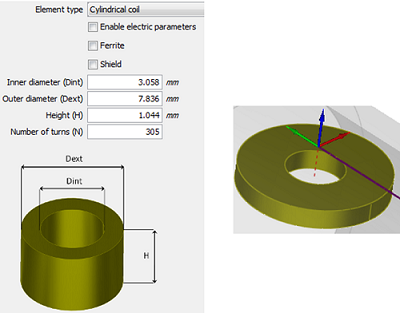
Geometrical characteristics of the probe, here defined in the CIVA panel.
Defect
The tube contains a longitudinal through wall notch of 12.2 mm length notch, with the same thickness as the tube, ie 1.175 mm, and with an angular extension of 0.585°.
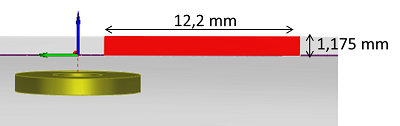
Geometrical characteristics and positioning of the notch
Comparisons between CIVA and the experiment
The experimental measurements have been realized with an impedancemeter, it has also not been necessary to calibrate the results before the comparison.
Lissajous curves are drawn and the amplitudes, phases, real and imaginary parts as a function of the scanning are represented on the figures below for the frequencies 25, 50, 100, 150 et 200 kHz . A good agreement between experiment and simulation is observed.
Then, the amplitude and phase values are gathered in a table and the difference between acquisitions and CIVA simulations are calculated. The small differences confirm the good agreement between CIVA and experiments.
25 kHz
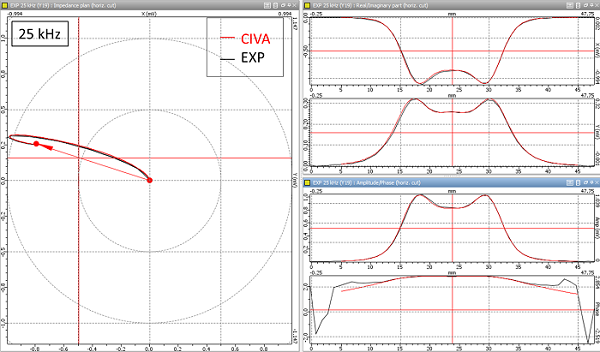
CIVA/Experiment comparison at 25 KHz. Left handside: Lissajous curve, right handside from the top to the bottom: real part, imaginary part, amplitude and phase.
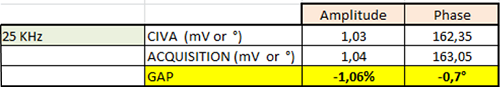
CIVA/Experiment comparison tabel of amplitude and phase values at 25 kHz.
50 kHz
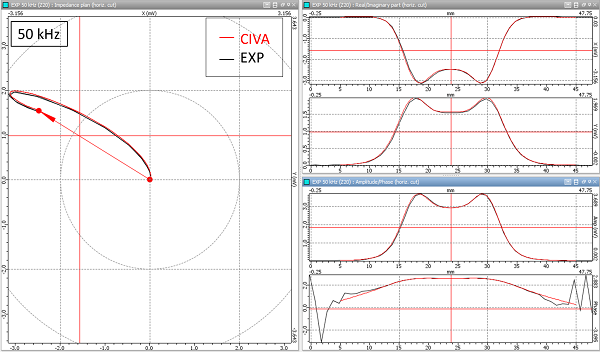
CIVA/Experiment comparison at 50 KHz. Left handside: Lissajous curve, right handside from the top to the bottom: real part, imaginary part, amplitude and phase.

CIVA/Experiment comparison tabel of amplitude and phase values at 50 kHz.
100 kHz
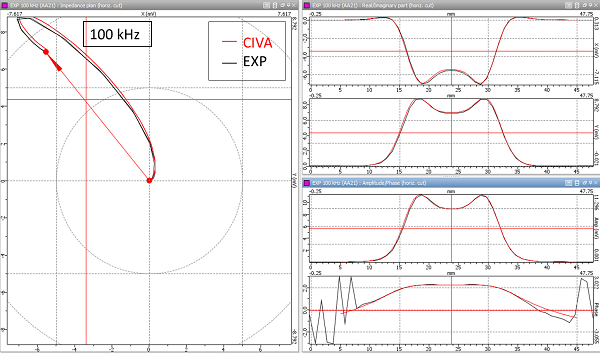
CIVA/Experiment comparison at 100 KHz. Left handside: Lissajous curve, right handside from the top to the bottom: real part, imaginary part, amplitude and phase.
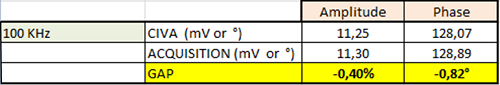
CIVA/Experiment comparison tabel of amplitude and phase values at 100 kHz.
150 kHz
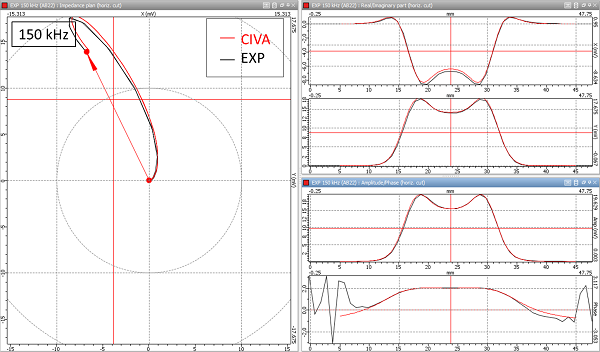
CIVA/Experiment comparison at 150 KHz. Left handside: Lissajous curve, right handside from the top to the bottom: real part, imaginary part, amplitude and phase.
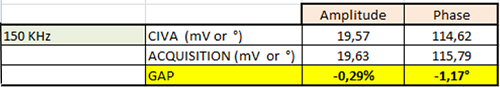
CIVA/Experiment comparison tabel of amplitude and phase values at 150 kHz.
200 kHz
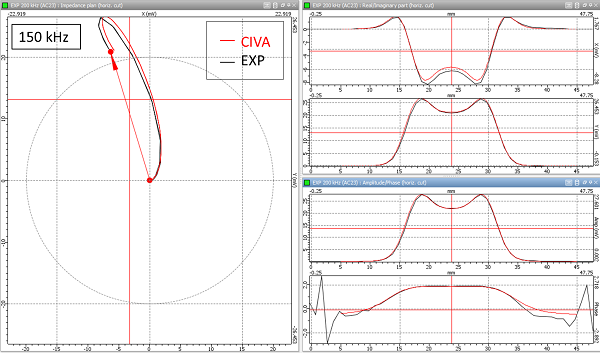
CIVA/Experiment comparison at 200 KHz. Left handside: Lissajous curve, right handside from the top to the bottom: real part, imaginary part, amplitude and phase.
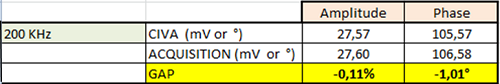
CIVA/Experiment comparison tabel of amplitude and phase values at 150 kHz.
Finally, on two synthesis graphs are superimposed CIVA and acquistion curves. The first one shows the evolution of the amplitude as a function of the frequency, and the second one represents the evolution of the phase still as a function of the frequency.
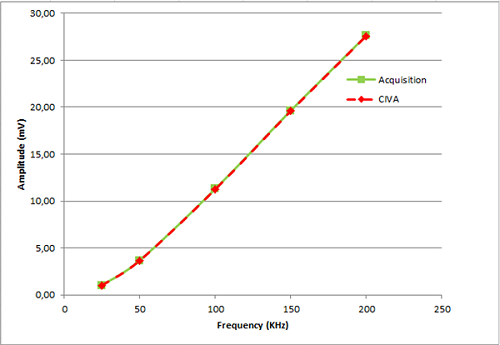
Amplitude evolution as a function of the frequency for CIVA and the experiment.
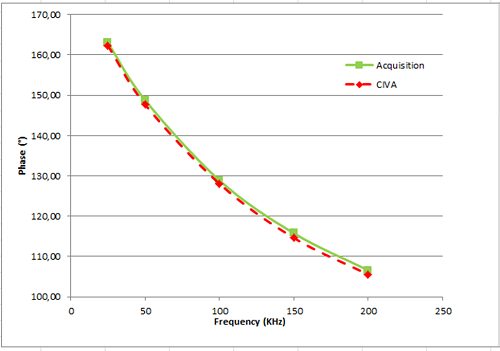
Phase evolution as a function of the frequency for CIVA and the experiment.
The good agreement between CIVA and the experiment is confirmed again by this graphs.
Go to TUBE INSPECTION WITH AN ENCIRCLING COIL
Go back to STEAM GENERATOR TUBE INSPECTION WITH AN AXIAL PROBE
Go back to TUBES