
Ultrasonic Testing Analysis with CIVA
Summary
The CIVA UT Analysis module’s main objectives are to display acquisition DATA in an easy and understandable way, to extract advanced information in an efficient way, to put this data into a dynamic report and to avoid repeatable and time consuming manipulations.
All the necessary tools
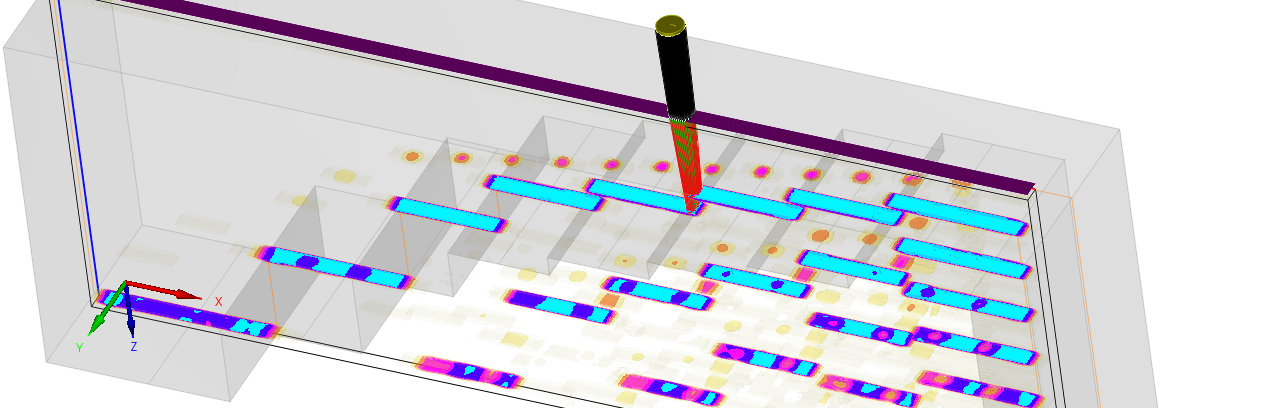
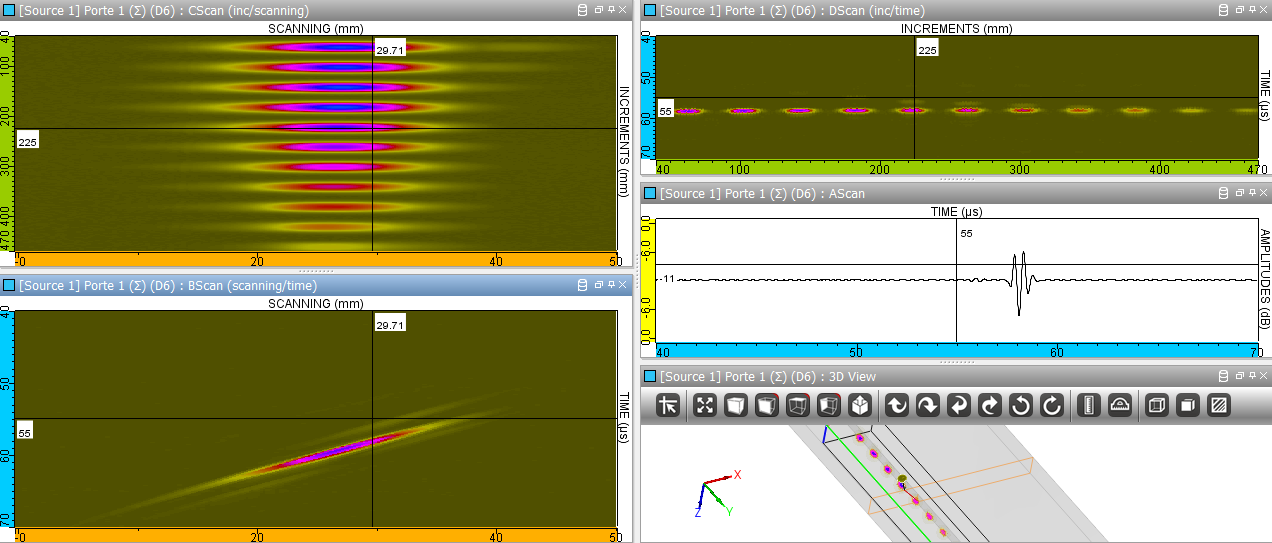
Data is displayed as classical UT data (A-Scan, echodynamic curves) or more advanced images (B-Scan, C-Scan, S-Scan, E-Scan, etc.). Images in the specimen frame can also be displayed (front, top, side sections or full views) and the data can be exported in the 3D view with the specimen as 2D images or directly as 3D with the one-click 3D view. Note that images can be built from amplitude, depth or time of flight.
Zooming is easy and fast. From the active zoom, an extraction can be performed that creates a new data set.
The Colormap can be adjusted. A double cursor is available along with all classical tools for images (mirrors, rotation, copy and paste, distance measurements…).
Acquisition gates can be added, adjusted in time (reduced) and even synchronized (on specific echoes) to recreate a new data set.
Amplitude histogram can be created in one click for a selected ROI. It represents the number of points having the same amplitude for all amplitudes in the ROI.
If you have some mechanical play in your system, you can easily improve your acquisition data with the Hysteresis correction.
A Ray Tracer is available with a direct link to the time cursor so that you can easily identify complex echoes. The functionalities have been extended in order to be more efficient and easier to use.
For TOFD inspection, CIVA Analysis provides lateral waves linearization and deletion tools, as well as calibration and hyperbolic cursors.
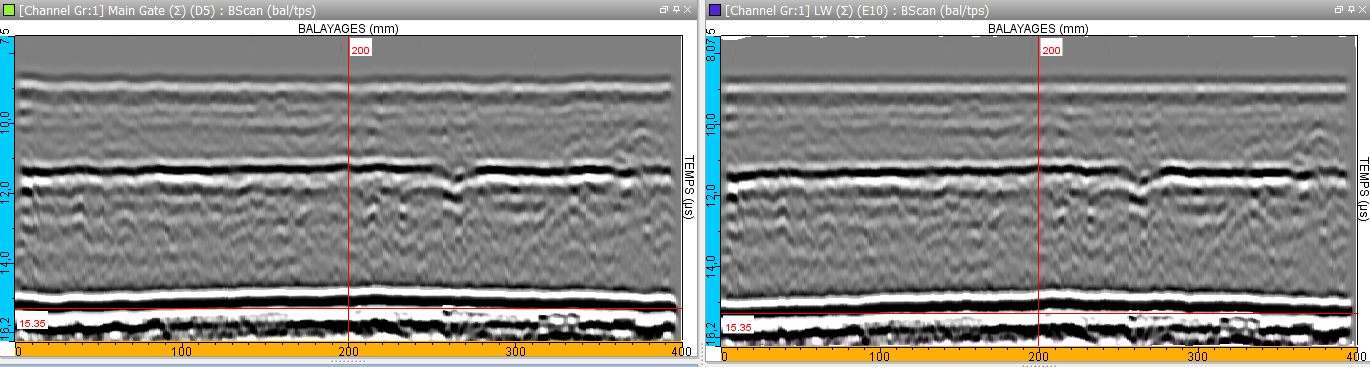
TOFD files analysis: Linearization of the lateral wave
Advanced tools: the one-click advantage
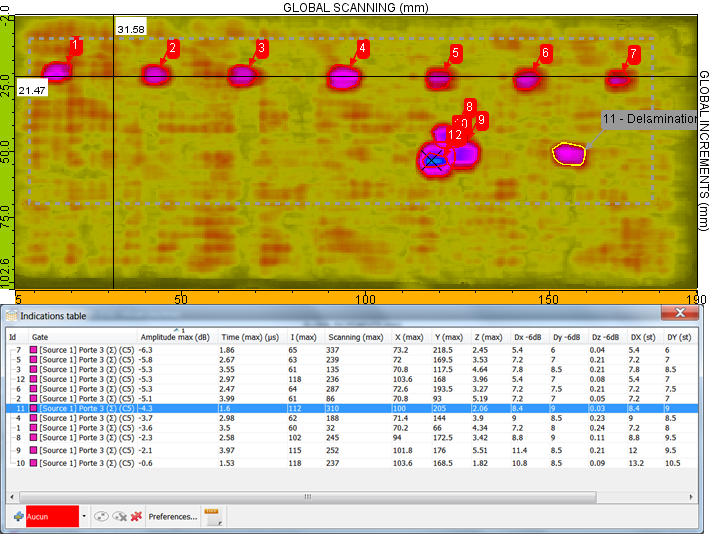
The objective to easily and quickly extract interesting information has been reached, through first, the selection of a region of interest (ROI), then through one-click tools such as “-xdB contour” or Segmentation. Note that Segmentation makes groups automatically represented in the 3D display. These operators can be pre-selected in order to be more efficient. The environment can be configured with profiles that will be applied automatically.
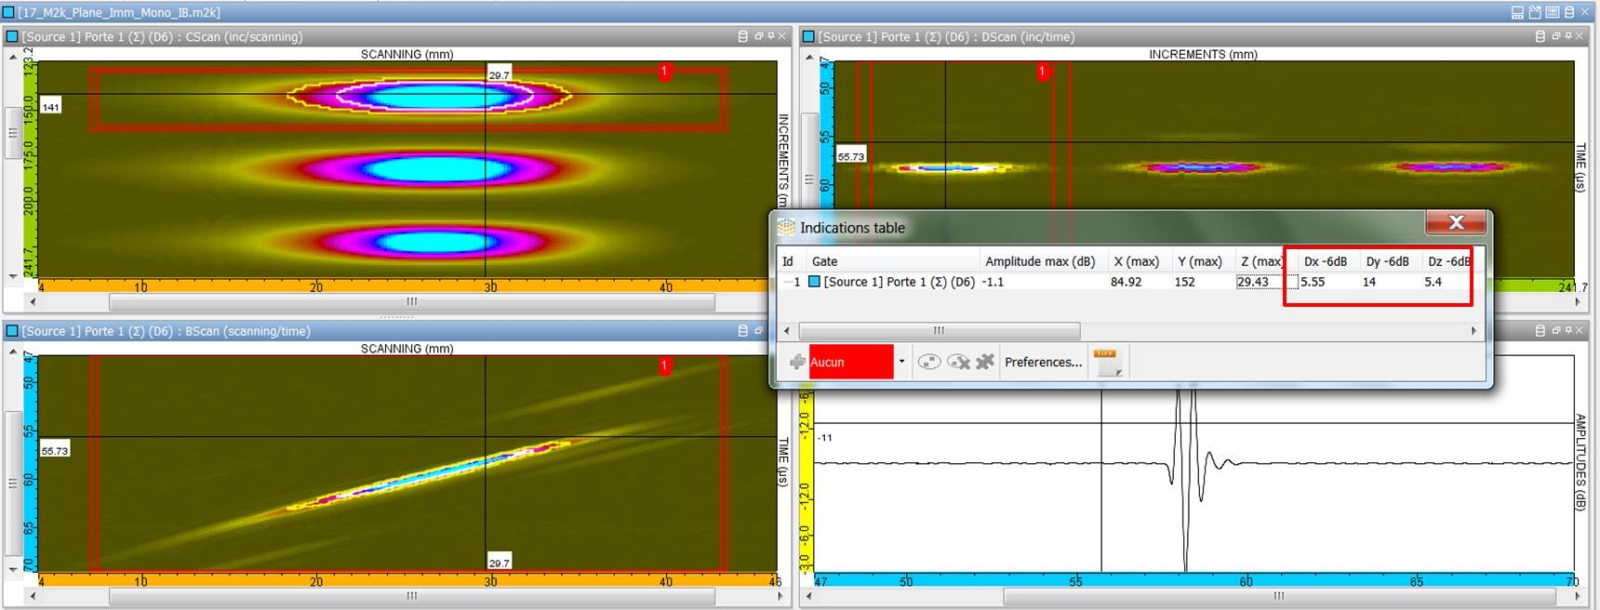
Indication table with −6 dB sizing
Relevant information (amplitude, position, size…) is included in an indication table in one click: images, distances, type of indication or other comments can be added. Multiple indications can be grouped as one indication. Columns of this indication table can be selected, sorted among a long list of available data.
Filters can be applied on the indication tables. This will allow to facilitate the selection of elements. This indication table can be exported in CSV format or an HTML report can be generated in one click.
In parallel, to help with the diagnosis, multiple functionalities are available: a wide range of signal processing methods, some are classical (filters, etc.), others are more sophisticated (wavelets transforms, deconvolution methods, Split Spectrum).
Indication table generated from segmentation
The stand-alone version of CIVA UT Analysis module also proposes simulation in a ROI, based on the diagnosis you want to try (planar defect).
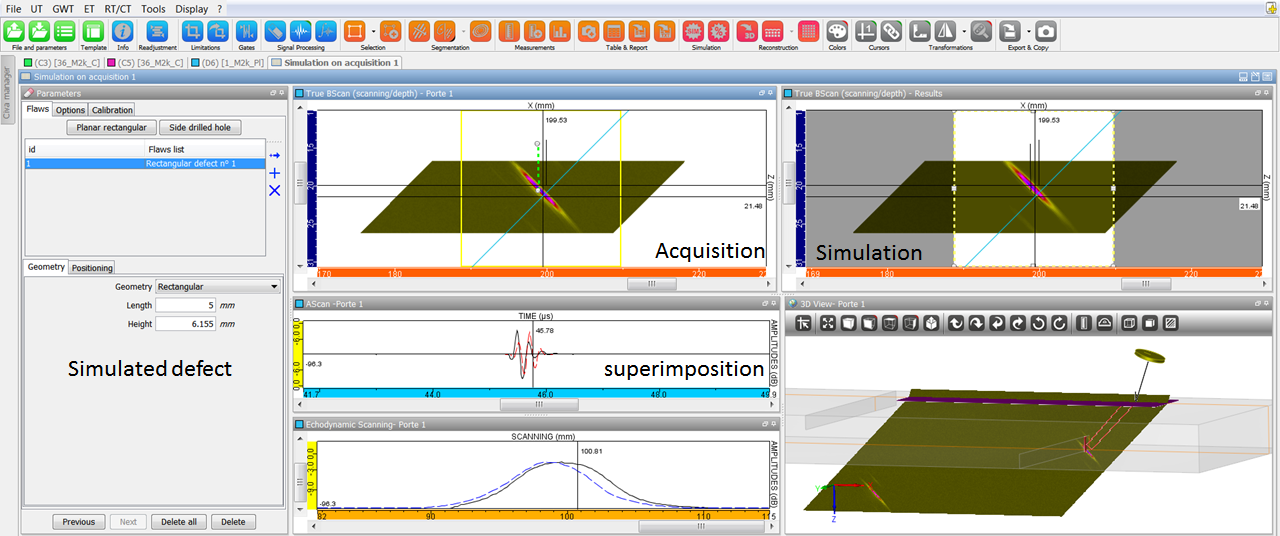
Simulation on acquisition
If you use the latest techniques like TFM (Total Focusing Method), you can make appropriate reconstructions and even redraw the surface of your specimen in one click.
A data eraser facilitates multiple points selection with the exclusion of a global region. This can be very useful and efficient and remains safe as a new data set is created and the original one remains unchanged.
Calibration can be adjusted as a post processing. A DAC correction can also be made on the data.
Make your work environment more efficient
You can customize your use of CIVA UT Analysis to drastically reduce repeatable actions, to have a convenient environment, and to integrate part of your different analysis procedures.
If you perform multi-salvo inspections (or multi probes in the same data file), CIVA offers the possibility to work on these salvoes with links between cursors and to modify the settings of each transducer position and the reference position (origin) of the specimen.
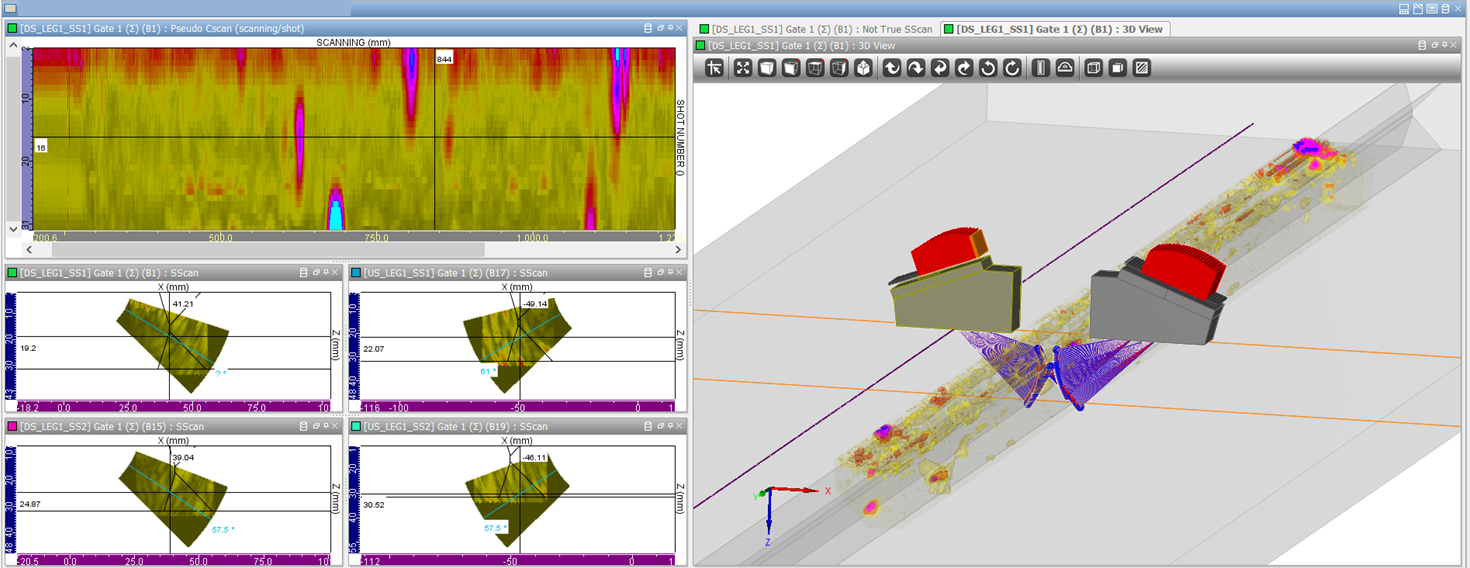
Multi-salvo results
Layouts are still available that let you place the images where you want, with the size and the contents you define. Give a name to each layout and recall it when you need to.
In the preferences, “user profiles” with different names can be created. In these profiles, three default thresholds can be defined for “contour at –xdB”, the contents of the report (contents and order of each column) can be adjusted, and the type of defects (names for indications such as cracks, volumetric, corner echo, geometrical echoes…) can also be created.
Each of these profiles can be loaded at any moment.
An important part of your work can be defined as a template. This means that you can give a name to some of the actions you currently do (for example add a gate, synchronize it, open a new tab, make a limitation in it, define analysis operators and zone of analysis, etc.) and this operation will be completely automatic when you recall it for a similar file: avoid errors, save time and put your efforts on the real work of analysis!
Delay laws calculator
CIVA UT Analysis lets the user compute the delay laws and sequences of delay laws for standard and advanced phased-array techniques.
This module includes all possibilities of CIVA UT regarding Delay Laws computation (see previous description of the CIVA UT inspection simulation module for more details).
Go further with the “CIVA Analysis Advanced” package!
With the Advanced analysis package, you will be able to perform beam simulations coming from the leading simulation software CIVA.
With this option, you can also use CIVA Script to drive your UT analysis process without using the Graphical User Interface. You will also be able to load and compare simulation files with acquisition files, and the delay laws calculator also lets the possibility to export this information in *.raw and *.pte ASCII files. It includes both delay laws and index points data.
For more information regarding the complete of features of the simulation software CIVA UT, visit our dedicated page.