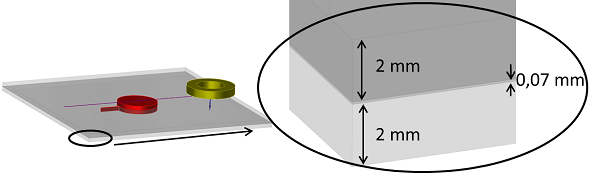
Pièce
Here the trilayerd specimen is the same as the one of the case 2, but inspected from the other side, by the same coil as before, what only changes the positionning of the flaws relatively to the probe.
Multilayers specimen
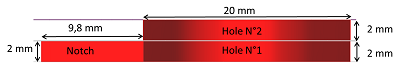
flaw
The plate being overturned relatively to case 2, the notch is in this case located in the bottom plate, as drawn below.
Notch and two FBH present in the plate to inspect
EXPERIMENT/SIMULATION COMPARISONS
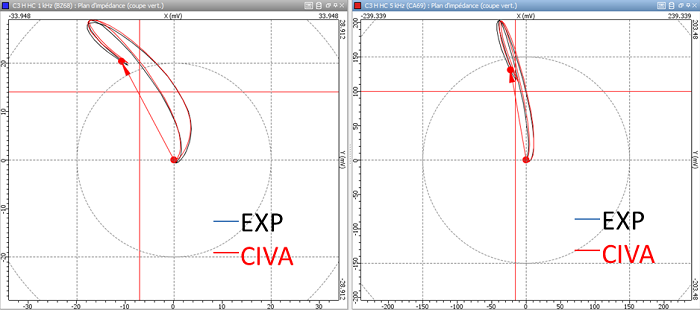
The experimental measurements have been realized with an impedancemeter, it has also not been necessary to calibrate the results before the comparison.
Lissajous curves in impedance plane, vertical cut, 1 kHz (left) et 5 kHz (right)
From top to bottom, then from left to right hand side : Amplitude, Phase, Real part, Imaginary part. Comparisons between experimental results (black curve) and simulation results from CIVA (red curve) for the case N°3 at 1kHz (top) et 5 kHz (bottom)
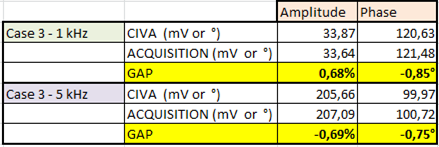
Maximal amplitudes values and corresponding phases, and discrepancies between CIVA and experiment (references: experimental values).
On figures below are superimposed experimental and CIVA curves. A good agreement is observed between experiment and simulation.
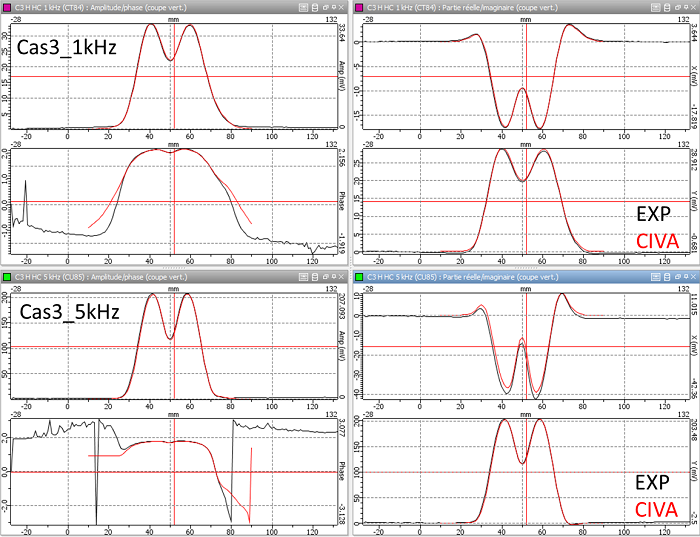
Finally, the table below gathers ampltudes and phases values and confirms the very low gap between experiment and simulation, less than 1 % in amplitude and 1° for the phase.
Continue to MULTILAYERS - CASE N°4
Go back to MULTILAYERS - CASE N°2
Go back to MULTILAYERS