
TOFD: Presentation of the studied configurations
Summary
- Test bench and reproducibility
- Specimens and material
- Transducers
- P60 Probe
- P45 Probe
- P70 probe
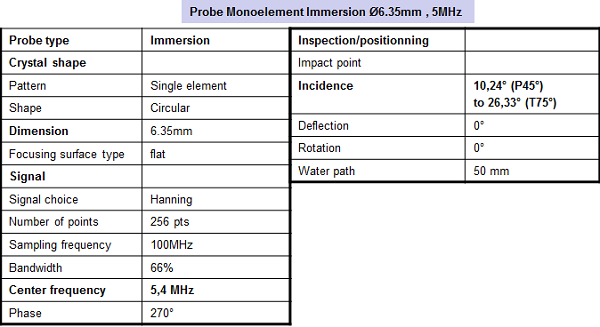
- 5 Mhz Immersion probe
- uncertainties
- Effet of the presence of coupling material in the notch
- SIMULATION parameters
- Simulation models
- Parameters for the notches
- AMPLITUDE and time of flight comparisons
- Amplitudes
- Time of flight
The experimental set-up hardly changes between the different treated cases. It is always contact TOFD configurations radiating P waves in steel specimens. Three different echoes are studied: echoes from SDH of different diameters (for calibration) and the top and bottom edges diffraction echoes of notches of different heights.
Test bench and reproducibility
Experimental tests were carried out using a ultrasonic acquisition system MultiX sold by M2M. The electronics is controlled through the Multi2000 software (v 5.6.22) that ensures configuration control, description, acquisition and representation of ultrasound data.
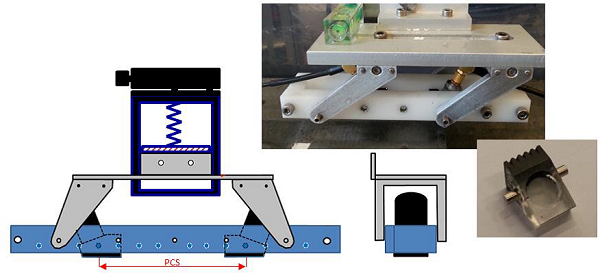
In order to realize automatic acquisitions providing C-scan results, the transducers are attached, by means of a suitable TOFD inspection mechanics, to a “micro control” 3-axes mechanical bench. This allows fine adjustment of parameters such as the PCS, accurate probe orientation and good contact between the wedges and the specimen surface. To ensure fine acoustical coupling, a gel is applied between the wedges and the surface specimen. A photo of the complete TOFD experimental set-up is presented below:
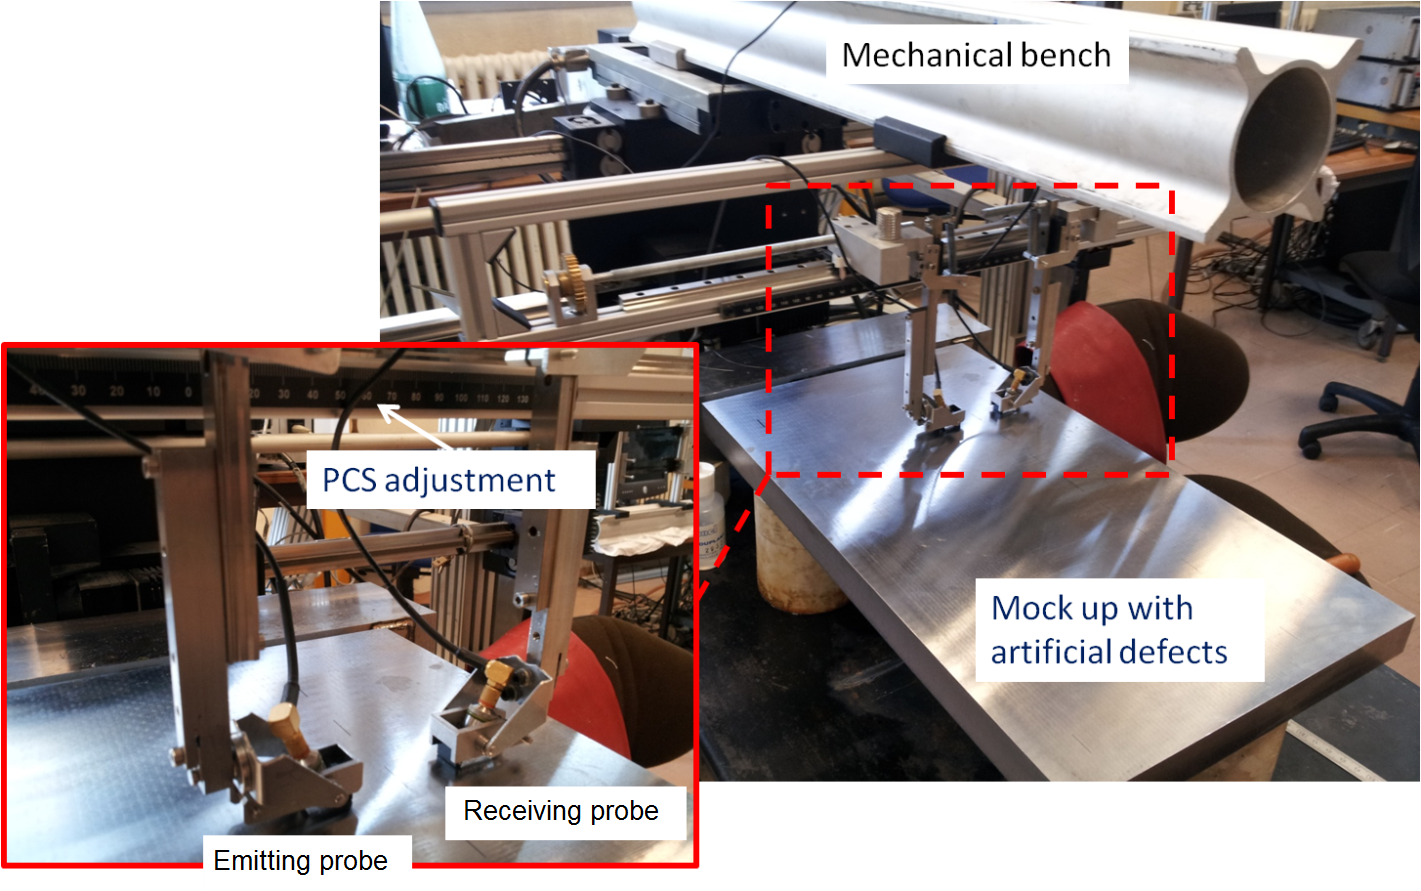
Diffraction echoes of a vertical notch are highly dependent on the incidence angle of the rays reaching it. Diffraction echoes are also dependent on the flaw position in transducers field. Varying the PCS can change these two parameters. By this way, the detection of notch diffraction echoes can be optimized.
For the study on the lateral wave and echoes from the lower tip of notches, the test bench has been updated with a new device in order to adjust precisely the PCS and to ensure equal pressure on each transducer.
An experimental procedure that was adopted ensures a good experimental reproducibility sometimes difficult to obtain in TOFD configuration due to the constraints associated with the probes contact on the specimen. This procedure remains valid for configurations with planar surface specimen free of irregularities.
The experimental set-up is divided in three parts:
- The first part consists in achieving a set of mechanical adjustments to ensure optimal and identical coupling for both probes (transmitter and receiver) and to ensure repeatability between two different acquisitions (after complete disassembly and reassembly of the experiment, for example). After these initial settings for a given PCS, the amplitude value of the lateral wave is retained and chosen as a reference value.
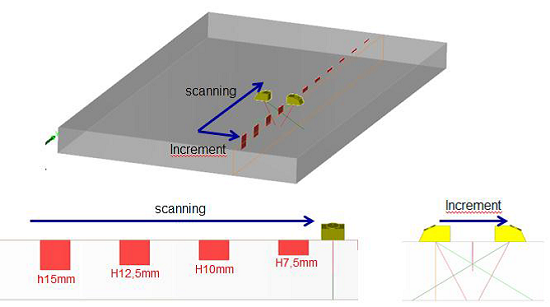
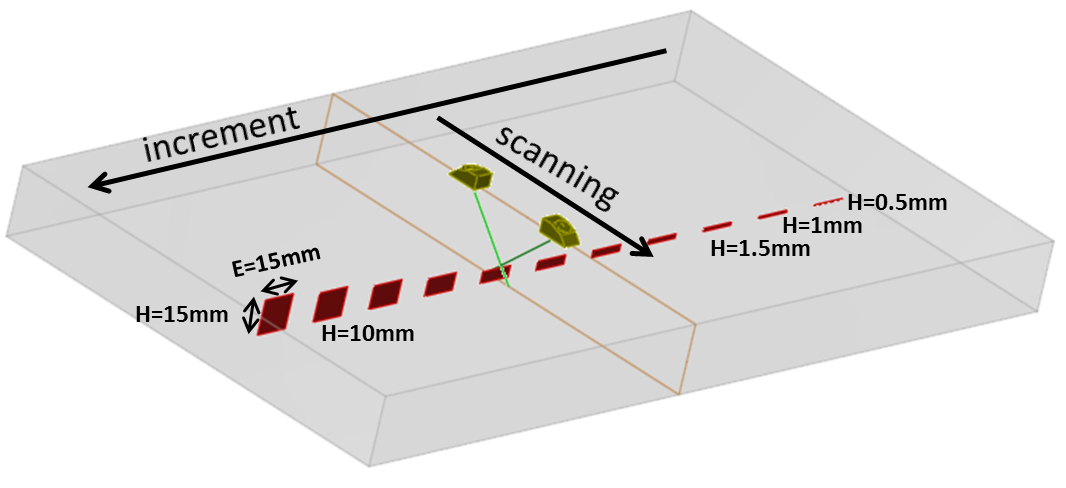
- The second part concerns the acquisition (mechanical displacement of the probes and data storage) which is performed taking as scan axis the axis parallel to the edge of the notch and taking as axis increments the axis perpendicular to the edge of the notch (Figure below). A C-scan is thus achieved with systematic storage of lateral wave.
The C-scan is used to assess the optimal scanning direction for amplitude recording. Indeed, there is often a scanning direction (forward or reverse) for which the probe coupling is better and free from unwanted vibrations.
The amplitude of the lateral wave is compared with the value of reference determined in the first part. The acquisition is considered acceptable if the difference between the two amplitudes does not exceed + / -2 dB for the chosen scanning direction.
The last part deals with the amplitude measurement. This step is also crucial in order to ensure comparable measurements between two different operators. This is a method working in two steps:
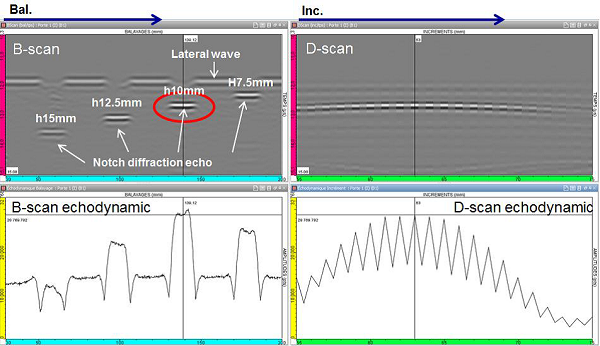
- Positioning of the “scan” cursor at the middle of the indication from the B-scan echodynamic (default from the center)
- Positioning of the “increment” cursor at the maximum amplitude of the D-scan echodynamic (selection of the increment corresponding to the best scanning for which the amplitude is maximum).
Specimens and material
The two specimens used to validate the CIVA software under TOFD configurations are made of steel and are presented schematically below.
The inspection direction for the “notches specimen”, used for the study of the top diffraction echoes, is illustrated on the figure above. To access the bottom edge diffraction echoes, the specimen is simply reversed.
Material density and waves velocities in steel are as follows:
| Density | 7.8 | g.cm-3 |
| P wave velocity | 5900 | m/s |
| SV wave velocity | 3230 | m/s |
No attenuation as been taken into account for L and T waves.
The attenuation due to the material has not been studied in this section. However, the attenuation due to the beam divergence is always taken into account by CIVA.
Transducers
Different contact transducers were used for this validation study. They consist in a couple of identical transducers (one for transmission, the other for reception). Wedges are made of plexiglas (density 1.18 g/cm^3 , P wave velocity 2730 m/s and SV wave velocity 1340 m/s). The wedges present a flat geometry and their dimensions are around 16*11.5*7 mm.
P60 Probe
The first couple of transducers are circular contact probes of Ø6.35 mm diameter and 5 MHz central frequency generating P waves at 60°. The calibration showed that the probe transmits a signal at 4.85 MHz with a bandwidth of 66 % and a phase of 310°.
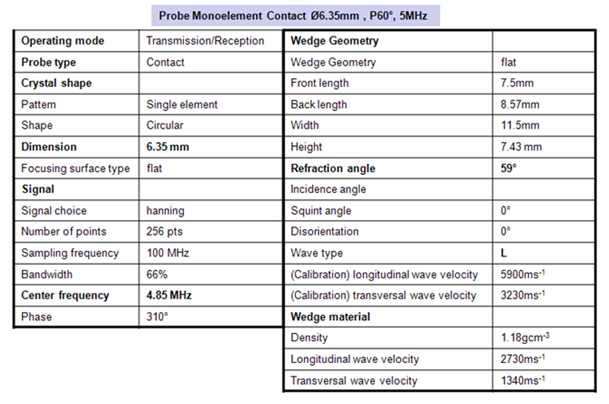
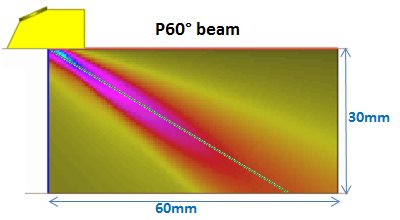
The transmitted beam is oriented at 59° as illustrated below:
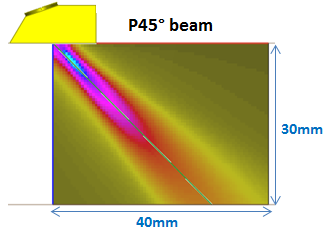
P45 Probe
The second couple of transducers are circular contact probes (diameter Ø6.35 mm and 5 MHz central frequency) generating P waves at 45°. The calibration showed that the probe transmits a signal at 4.85 MHz with a bandwidth of 66 % and a phase of 310°.
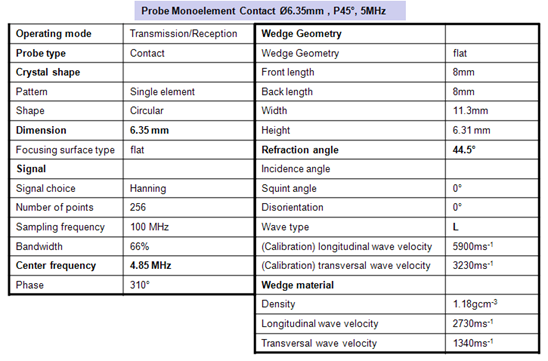
The transmitted beam is oriented at 44.5° as illustrated below::
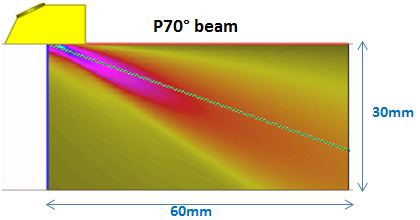
P70 probe
The probes of the third couple generate P waves at 70°. They are circular contact probes (diameter Ø6.35 mm and 5 MHz central frequency). The calibration showed that the probe transmits a signal at 4.85 MHz with a bandwidth of 66 % and a phase of 310°.
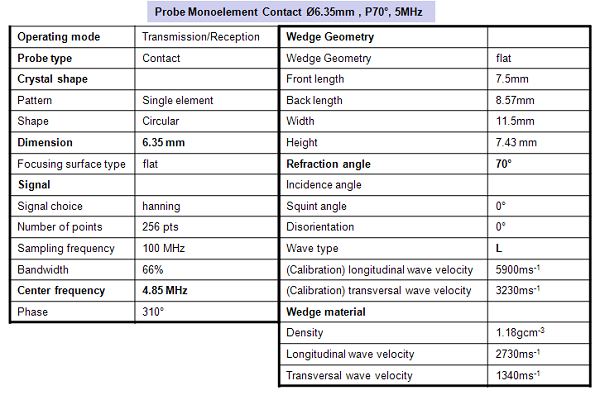
The transmitted beam is oriented at 70° as illustrated below:
5 Mhz Immersion probe
The last couple of probes are immersion probes. Just like the previous ones, they are circular contact probes (diameter Ø6.35 mm and 5 MHz central frequency).
uncertainties
Measurement uncertainties
In order to minimize sources of uncertainties, an experimental procedure was followed before acquisition. It consisted in checking the acquisition system, characterizing the probes… Uncertainties may be linked to:
- The mechanical adjustments
- The flaws machined in the mock-up
- The integrity of the specimen material (presence of inhomogeneities)
Uncertainty on the amplitude was assessed by verifying the reproducibility of experimental results.
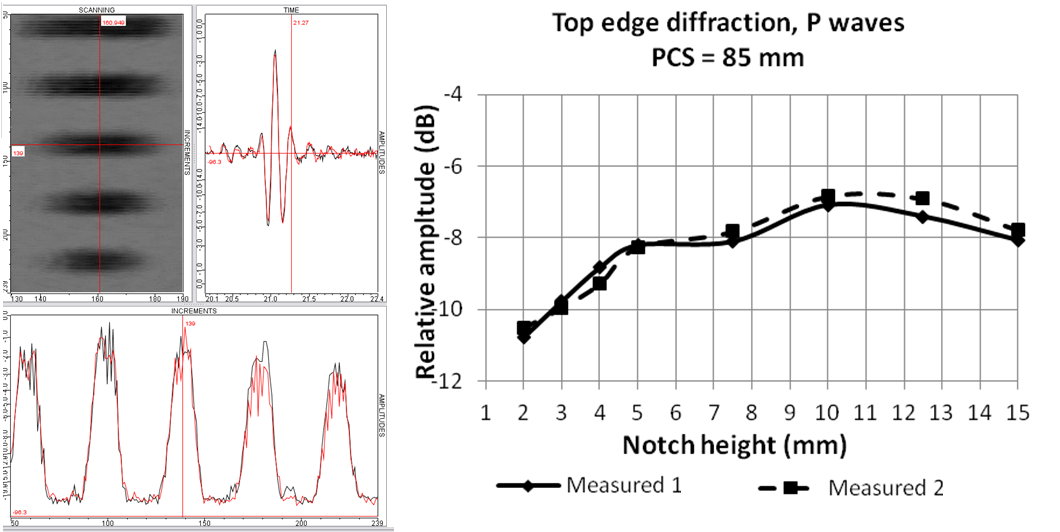
Uncertainties on SDH and echoes of notches top edges are determined to be +/-1 dB as shown below with a P60 probe with 5 MHz central frequency.
The uncertainty on the amplitude was estimated to +/- 3dB (1.5dB corresponding to the uncertainty measurement of the reference reflector and 1.5dB corresponding to the uncertainty in the measurement of the lateral wave).
Regarding the time of flight, the time base of the ultrasonic system is adjusted in pulse echo mode on a reflector having a known ultrasonic path (quadrant of the V2 specimen for instance). The measurement uncertainty was evaluated by checking the reproducibility of experimental results. It is +/- 0.5μs.
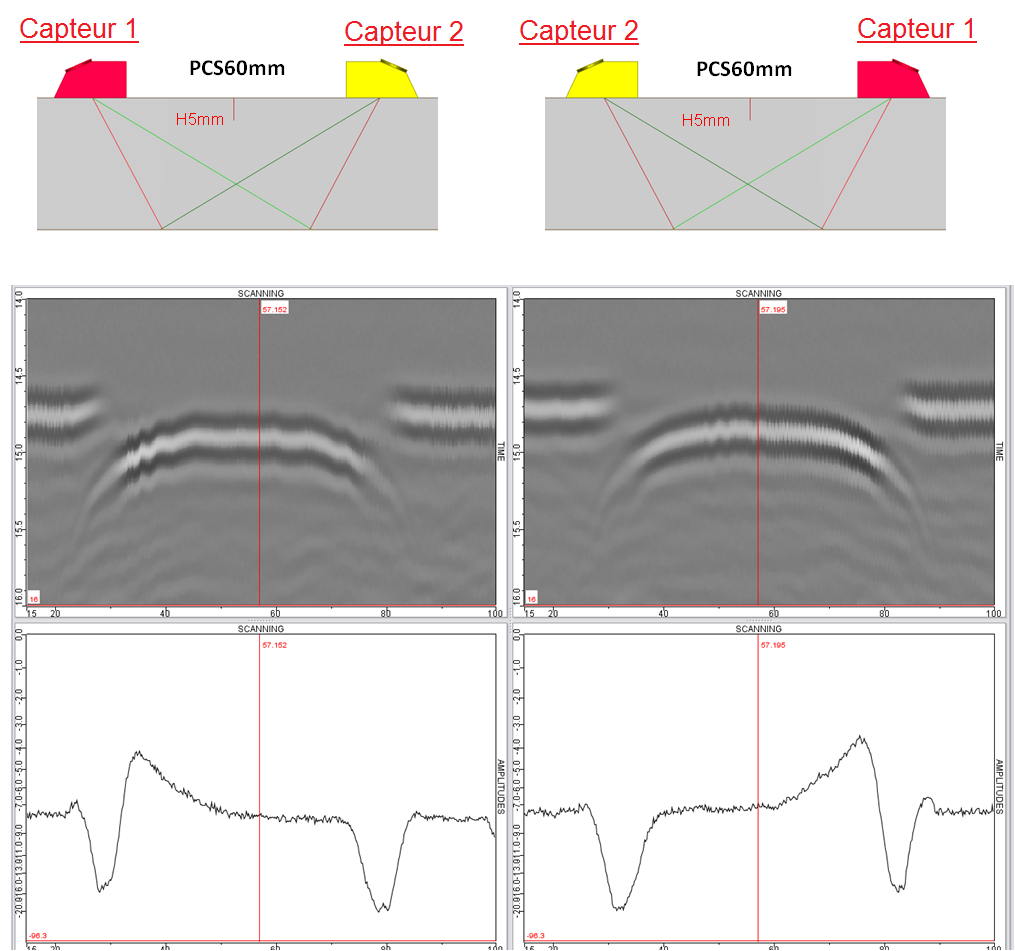
In some cases, results were asymmetric. This asymmetry is symmetric with respect to the flaw center when reversing the two probes. The reason is that the two transducers do not radiate exactly the same beam: for example one radiates at 59° and the other at 61°. When the asymmetry is observed amplitudes measurements have not been performed.
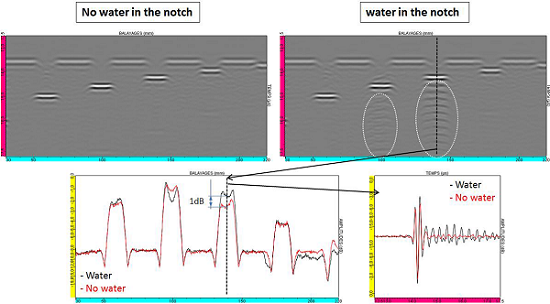
Effet of the presence of coupling material in the notch
The notch thickness is large enough for the coupling material gets inside. This is difficult to avoid when the PCS is low. To evaluate the impact on the bottom edges diffraction echoes due to the presence of coupling material in the notch, measurements were performed with and without the presence of the coupling. B-scans, superposition of A-scans and experimental echodynamic obtained with and without the presence of coupling in the 10mm high notch show that an effect of “resonance” appears after the time of flight of the diffraction echo. Furthermore, there is maximum 1 dB amplitude difference (see figure below). However, the shape of the diffraction signal is not affected and the amplitude difference is within the measurement uncertainty. Therefore, the effect of coupling has been neglected.
SIMULATION parameters
The experimental configurations were simulated with CIVA 10 for SDH and upper tip echoes validation. Accuracy was set at 3 for both field and defect calculation.
Bottom edge echoes, lateral waves and geometry echoes were simulated with CIVA 11.0a. Accuracy was set at 3 for both field and defect calculation.
Simulation models
- The interaction model “SOV” (Separation Of Variables) in order to model interactions between the beams and the Side-Drilled-Holes. This model takes into account the creeping waves propagation along the circumference of the SDH.
- The interaction model “GTD” (Geometrical Theory of Diffraction) in order to model the interactions between the acoustical beams and the notches edges.
-
The GTD model with the runtime variable “CALCUL_MULTI_VOIES”. CIVA_GTD_MULTIVOIES or CIVA_GTD_MV = consists in replacing a single element probe by a phased array probe of the same size and calculating diffraction echoes with the GTD model by enabling the runtime variable “MULTI-VOIES” in order to describe more accurately the ultrasonic beam used by the GTD algorithm when calculating interaction with the notches.
-
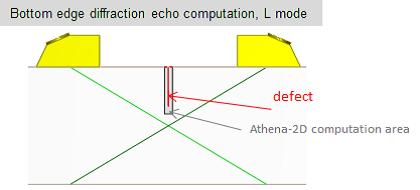
The « 2D » model CIVA-ATHENA for simulation of the bottom edge diffraction echoes of planer defects and multi-faceted flaws. The box surrounding the notch is always the same; this is a box of dimensions 2x17mm (figure below shows the case of a LW60° TOFD inspection).
- 3D Computation modes were selected for both beam and defect calculation with CIVA.
Parameters for the notches
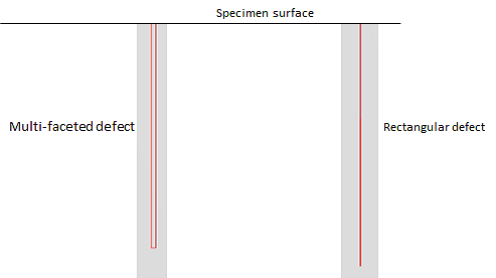
The notches are described by “rectangular” type defects with almost null aperture. This description does not correspond to reality because the actual aperture of the notch is about 0.2mm. However, the GTD (Geometrical Theory of Diffraction) model used for diffraction echoes calculation is only valid for defects with null aperture. The consequences of this approximation in the description of the notch will be studied using “multi-faceted” type defects (Figure below) describing more accurately the notches. However, the diffraction echoes can only be calculated in “2D “with the model CIVA-ATHENA.
AMPLITUDE and time of flight comparisons
Amplitudes
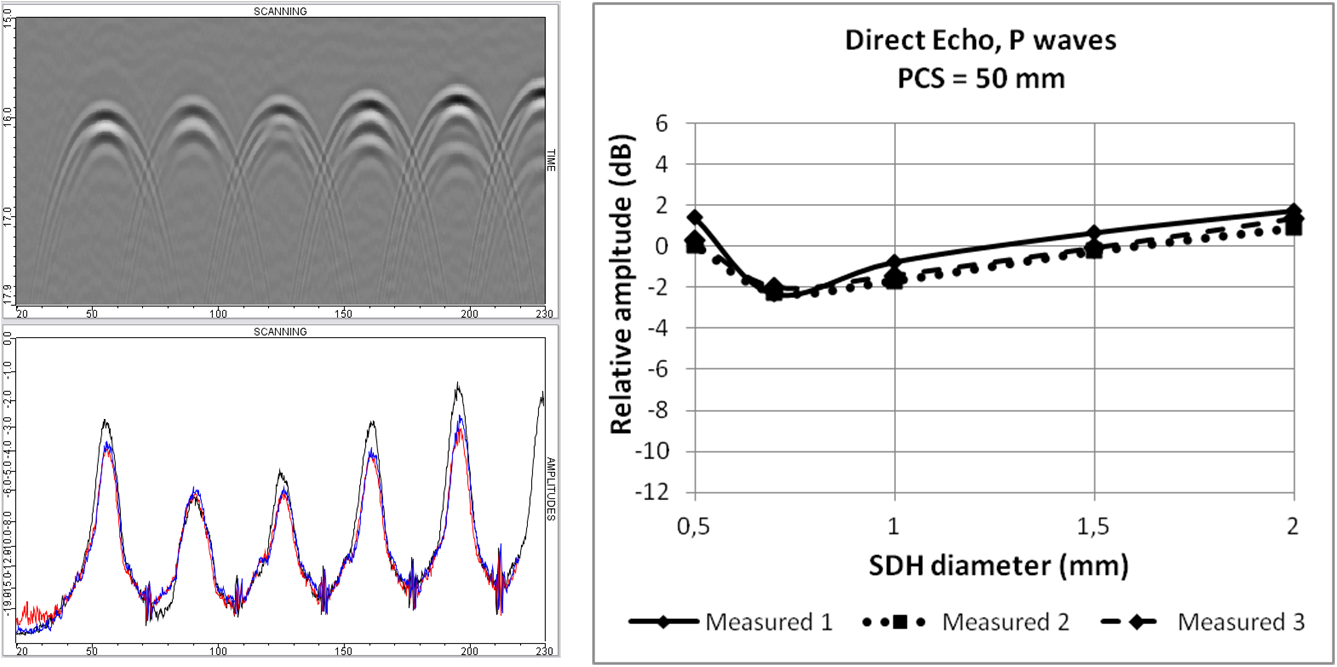
The amplitudes of the echoes presented and compared here were extracted on the experimental and simulated of rectified signals.
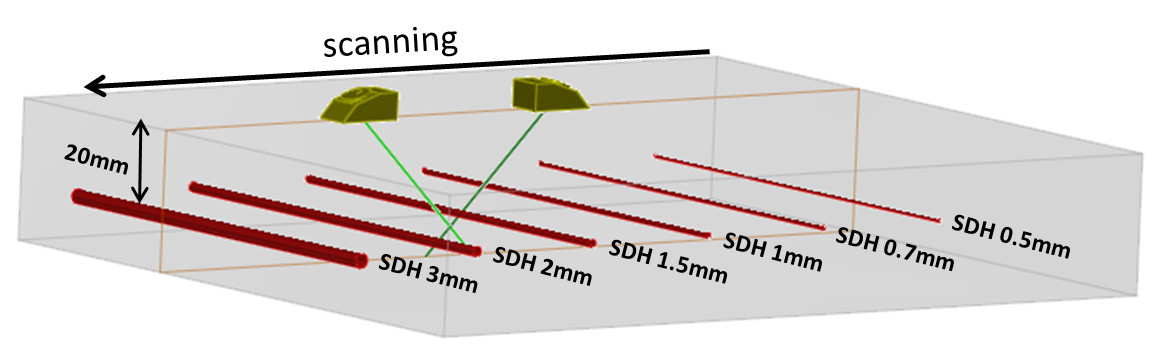
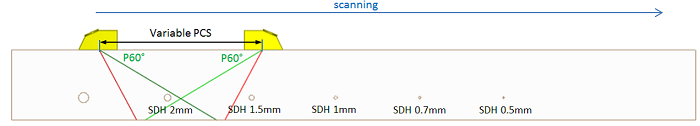
The reference for experimental and simulated amplitude comparisons is the maximum amplitude of the L direct echo of a Side Drilled Hole (SDHref) measured when PCS = Y mm. The PCS value of Y will be given for each couple of probe. The side drilled hole of reference is located at the same depth as other 6 other side drilled holes of different diameter located in a ferritic steel block of 30mm height (see figure below).
Time of flight
The time of flight of the echoes that will be compared in this document are absolute times of flight measured at the maximum amplitude of the rectified signal.
Continue to Results on Side Drilles Holes
Back to TOFD