
UT – Surface Echoes: Water path variation
Summary
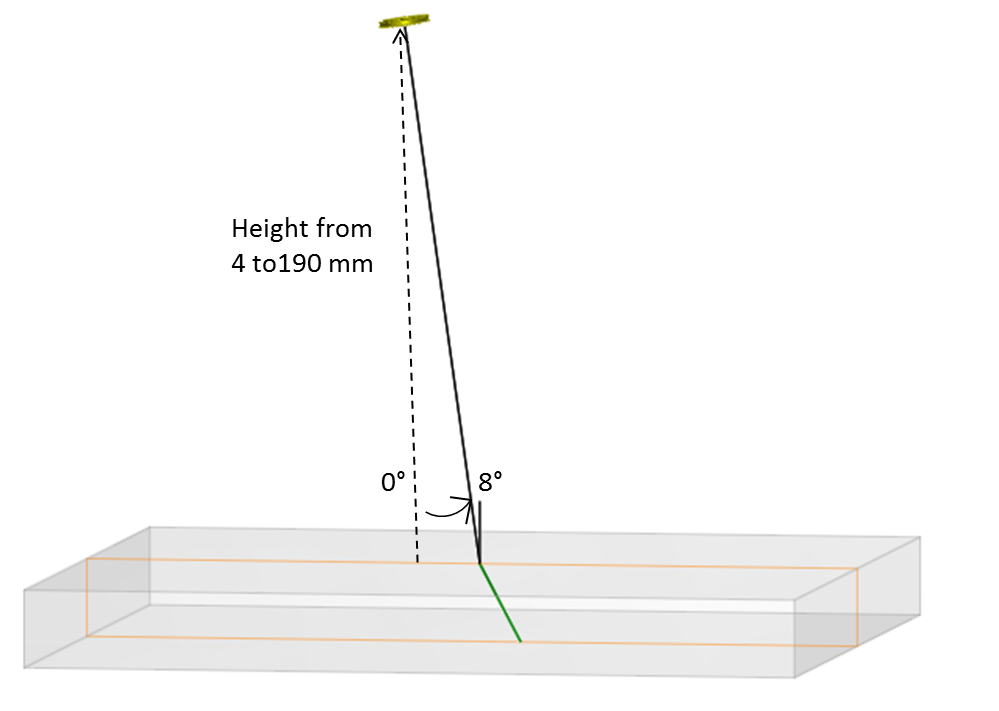
In order to evaluate the water path influence on the surface echo measurement during an immersion inspection, three immersion probes with different apertures are placed above a flat surface, at varying heights, from 4 mm to 190 mm, perpendicularly to the surface or slightly disoriented.
This study is carried out with three probes in immersion which characteristics are reported in the table below:
| Ø Crystal (mm) | Mode | Frequency (MHz) | Bandwith (%) | Phase (°) |
|---|---|---|---|---|
| 6.35 | L, 0° to 8° | 2.25 | 64 | 340 |
| 12.7 | L0° | 2.25 | 60 | 0 |
| 19 | L0° | 2 | 60 | 0 |
probe Ø 6.35 mm, 2 MHz, incidence 0° to 8°
| Ø Crystal (mm) | Mode | Frequency (MHz) | Bandwith (%) | Phase (°) |
|---|---|---|---|---|
| 6.35 | L, 0° to 8° | 2.25 | 64 | 340 |
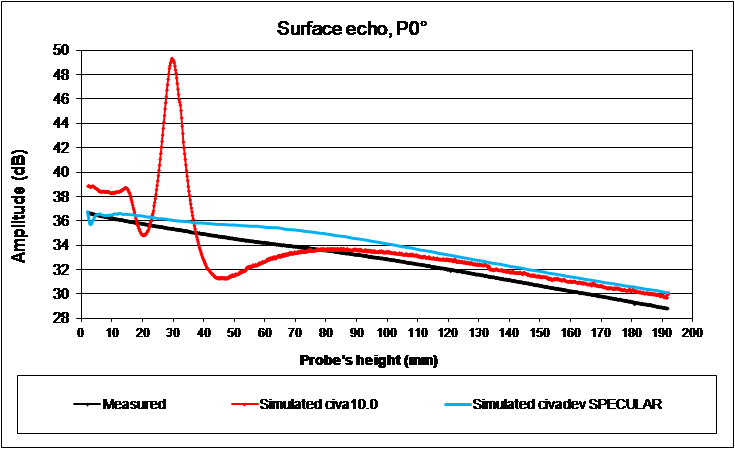
The results are calibrated from a Ø2 mm SDH , located at a depth of 28 mm. The amplitudes of the surface echoes obtained at different water paths and several probe incidence angles are plotted here below in black for the measured results, in red for Kirchhoff model results and in blue for specular model results.
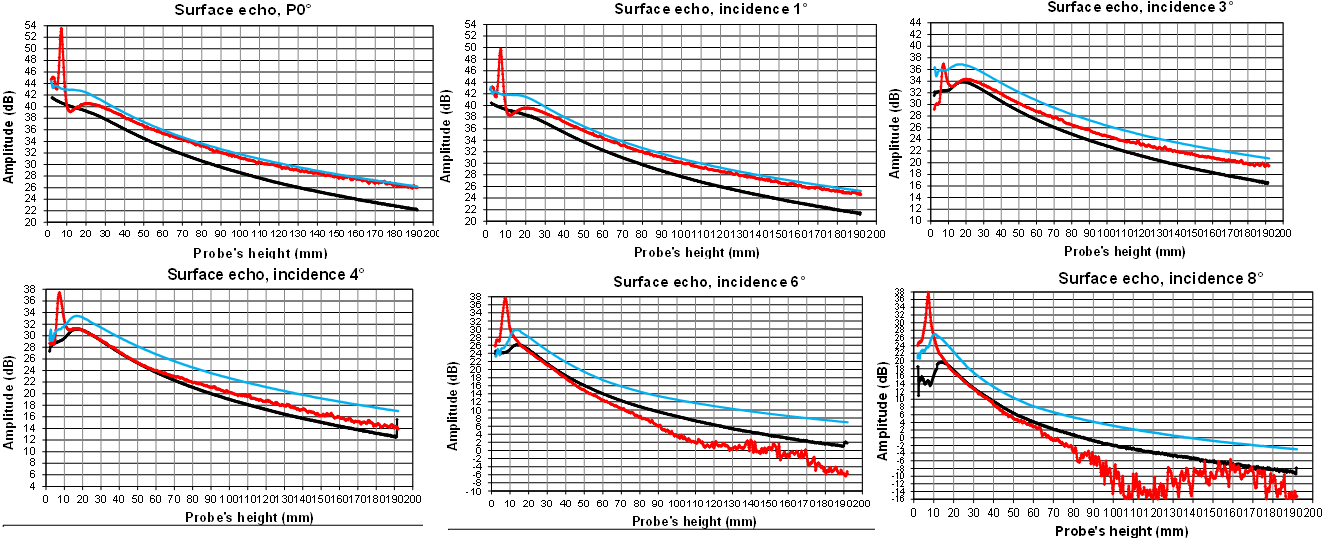
For small water paths, the Kirchhoff model predicts significant differences compared to measurements. Those differences are strongly reduced with the specular model. For big water paths, oscillations are observed with the Kirchhoff model. Those oscillations increase with probe incidence and disappear with specular model. Generally specular model always overestimates the surface echoe amplitudes by 4 dB to 5 dB, while Kirchhoff model overestimates those echoes for incidence angles from 0° to 4°, and then underestimates them for incidences from 6° to 8°.
The normalized amplitude Ascans are represented here below for two water paths and three different incidence angles, the red curve corresponds to the specular model and the black one to measurements.
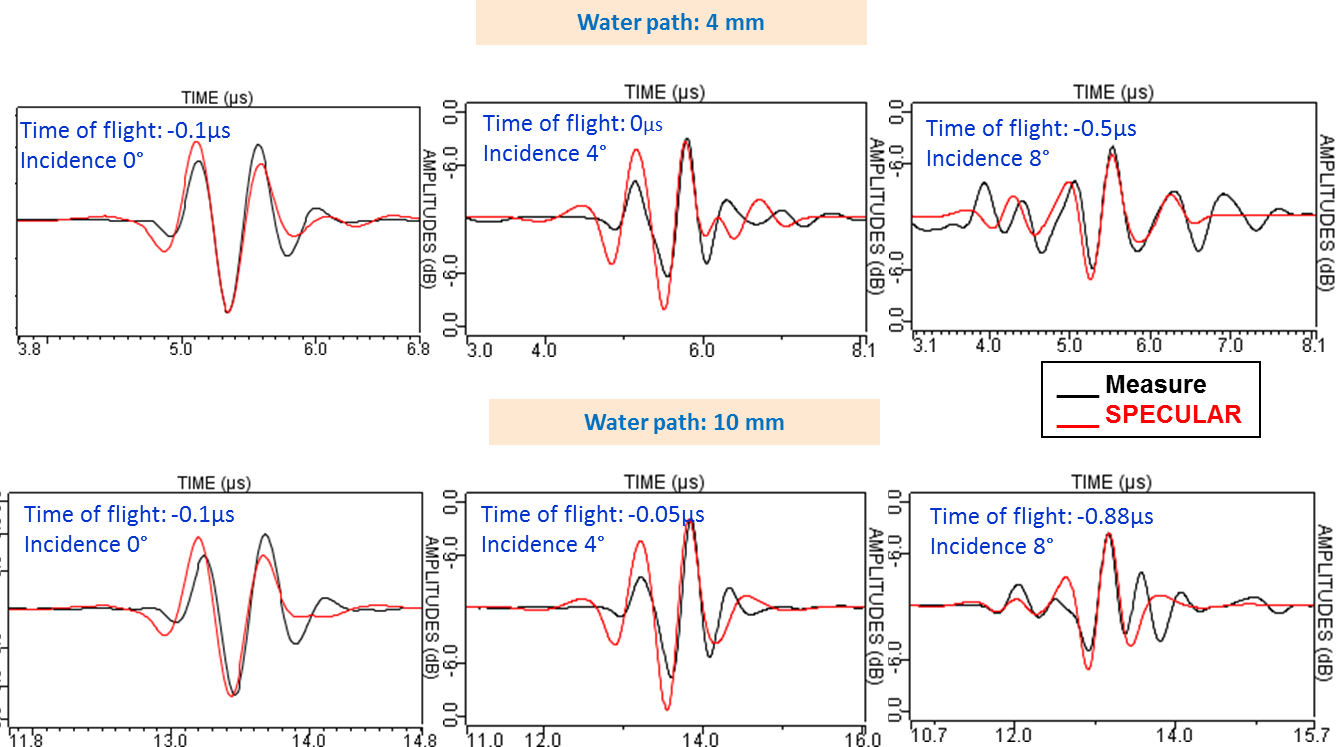
The specular model predicts correctly the Ascan temporal waveforms.
Probe Ø 12.7 MM, 2 MHZ, INCIDENCE L0°
| Ø Crystal (mm) | Mode | Frequency (MHz) | Bandwith (%) | Phase (°) |
|---|---|---|---|---|
| 12.7 | L0° | 2.25 | 60 | 0 |
The results are calibrated from a Ø2 mm SDH, located at a depth of 20 mm. The amplitudes of the surface echoes obtained at different water paths and for a probe incidence angle of 0° are plotted here below in black for measured results, in red for Kirchhoff model results and in blue for specular model results.
For water paths between 0 and 60 mm, specular model results are in better agreement with measured results than Kirchhoff model results.
The measured and simulated Ascans with the specular model are represented here below for three water paths, the red curve corresponds to specular model and the black one to measured results.
There are in good agreement with the measured results.
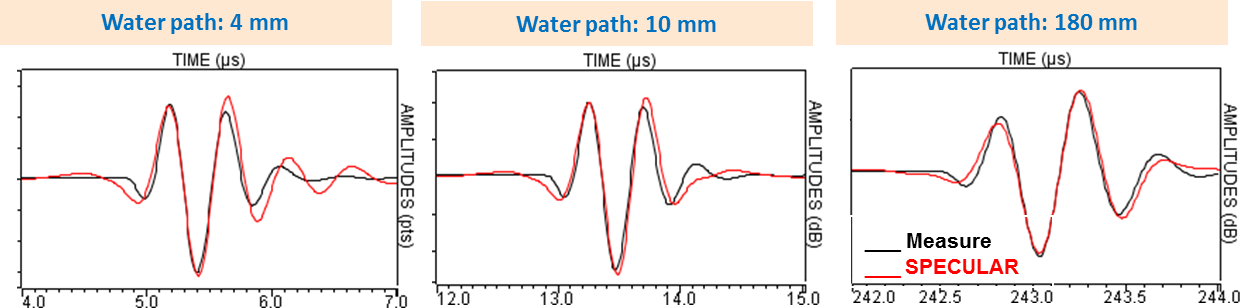
Probe Ø 19 MM, 2 MHZ, INCIDENCE L0°
| Ø Crystal (mm) | Mode | Frequency (MHz) | Bandwith (%) | Phase (°) |
|---|---|---|---|---|
| 19 | L0° | 2 | 60 | 0 |
The results are calibrated from a Ø2 mm SDH, located at 28 mm depth. The amplitudes of surface echoes obtained at different water paths and for a probe incidence angle of 0° are plotted here below in black for measured result, in red for Kirchhoff model results and in blue for specular model results.
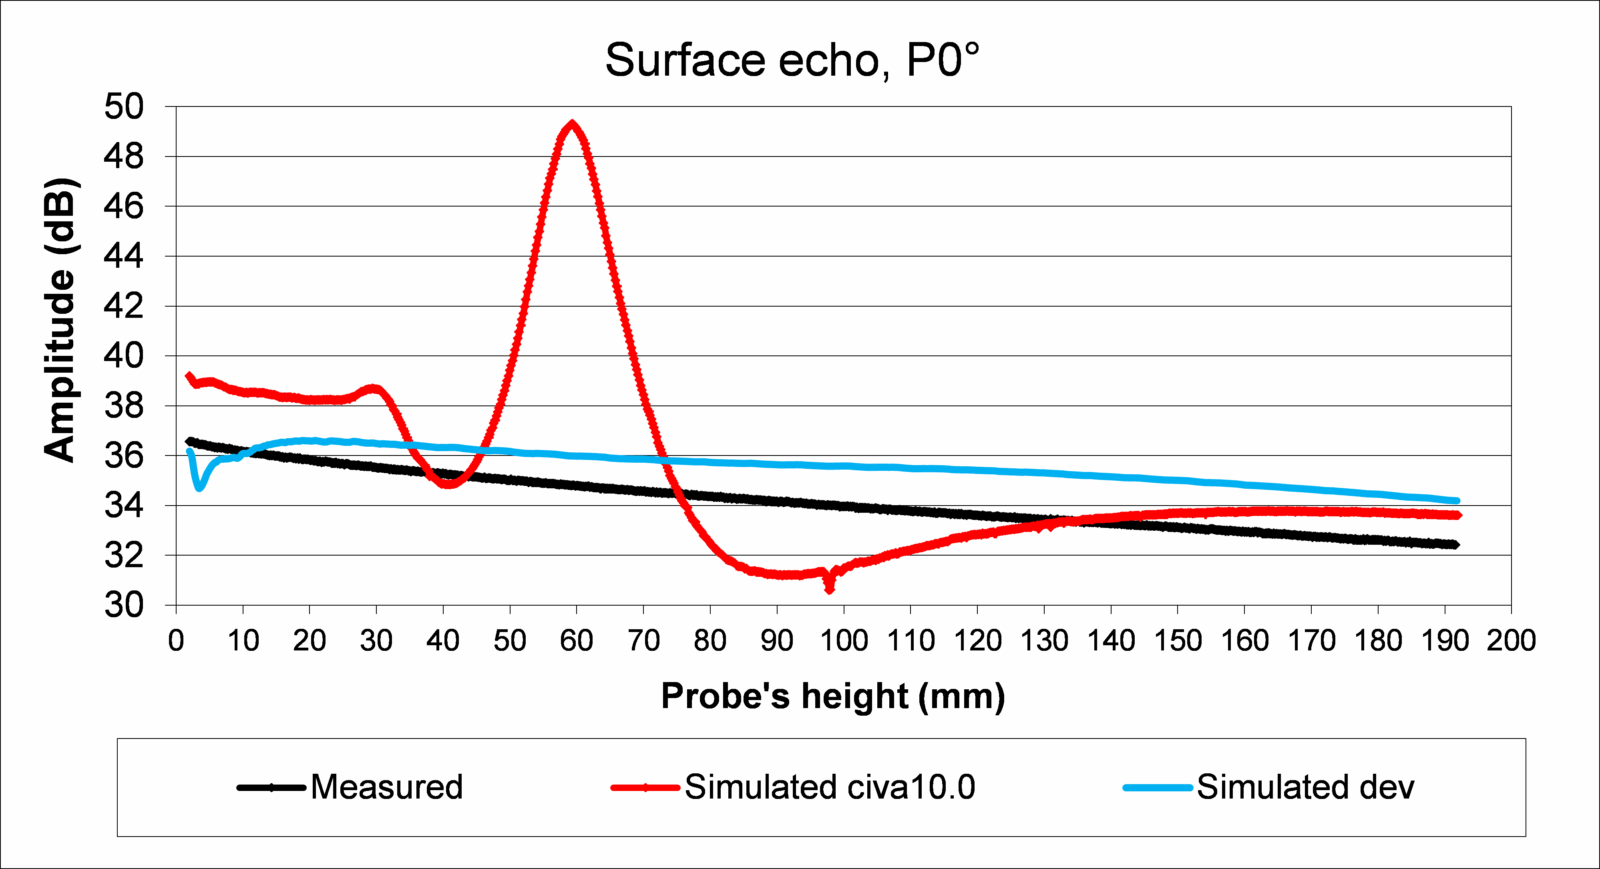
Whereas the Kirchhoff model diverges more from measured results when the probe diameter increases, the specular model stays close to measurements, with a maximal overestimation of 2 dB. A slight oscillation is noted for small water paths, less than 10 mm.
The measured and simulated Ascans with specular model are represented here below for three water paths, the red curve corresponds to the specular model and the black one to measurements.
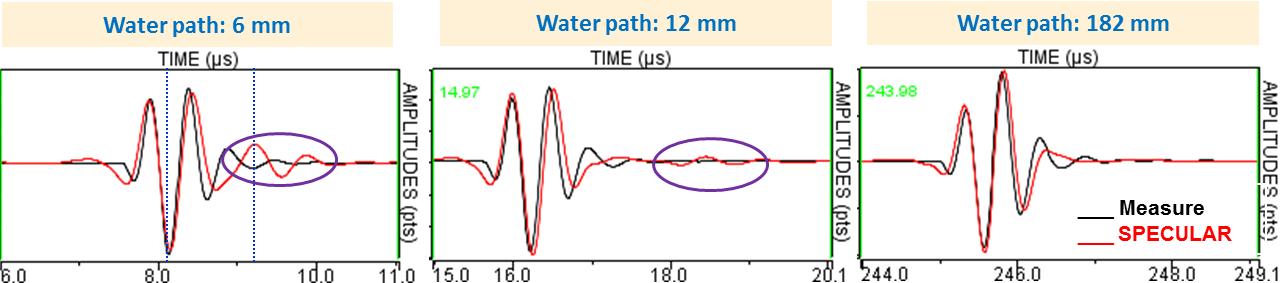
There is a good correlation between those signals. However, a small additional contribution is noticeable after a certain time on the simulated Ascans for water paths of 6 and 12 mm. This contribution illustrates a specular model limitation. An explanation is proposed here below:
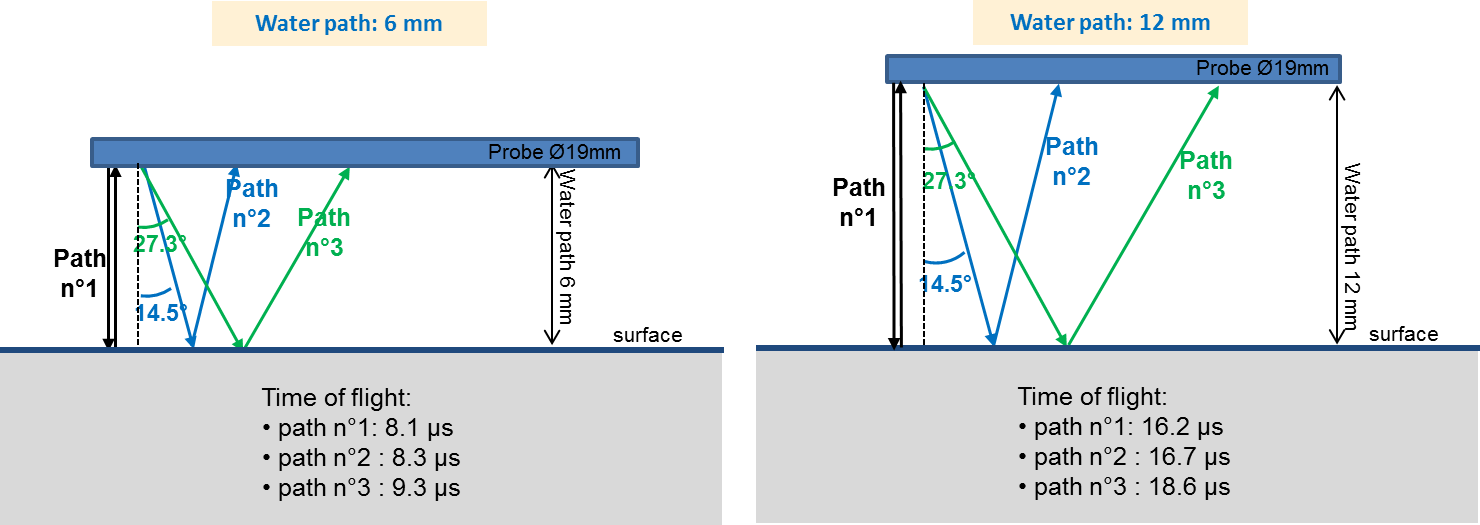
Among the three transducers used in this study, of 6.35 mm, 12.7 mm and 19 mm diameter, all at 2.25 MHz, only the 19 mm diameter one reveals an additional contribution on the simulated Ascan with the specular model compared to the experimental Ascan. Indeed, this probe of greater diameter produces two critical angles of L and T waves at a water/steel interface, respectively 14.5° and 27°. On the figure here below, the path n°1 in blue corresponds to the incident ray path close to the L-wave critical angle at the water/steel interface, the path n°2 in green corresponds to the T-wave critical angle. The time of flight calculation of the path n°1, which is the main contribution, and of paths n°2 and n°3 shows that the contribution n°2 which time of flight is very close to the time of flight of contribution n°1 cannot be distinguished from this one, while the contribution n°3, arriving 1 μs and 2 μs later, depending on the water path, constitutes the origin of the perturbation of the simulated Ascan with the specular model.
However, with the specular model, this contribution has a relatively high amplitude, which is not realistic. Indeed, in the reality, creeping waves are generated at the specimen surface by those critical rays and their contribution should be taken into account during the surface echo calculation. But it is not taken into account in the current model and the contribution of the critical rays’ surface echo is not correctly evaluated. A solution has been found to limit the effects of this problem, in the case of the fluid/solid interface, smoothing the phase value at critical angles of complex reflection coefficients.
Continue to Probe tilt variation
Back to surface echoes
Back to geometrical echoes