CONFIGURATION
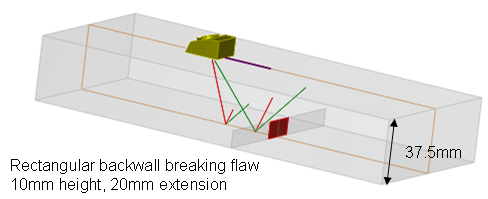
The probe used for these measurements is a circular contact probe of Ø12.7 mm diameter and transmitting P45 waves. The transmitted signal has a frequency of 2.25 MHz, a bandwidth of 50 % and a phase of 280°.
RESULTS
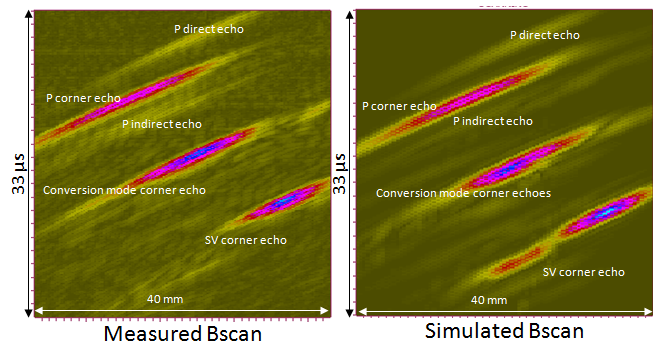
P, SV and conversion mode corner echoes appear on the B-scans. Direct and indirect diffraction echoes can also be identified. The corner echoes associated with mode conversion are also called mixed corner echoes. In the simulated B-scan, the SV corner echo is split in two contributions. The splitting is analyzed here.
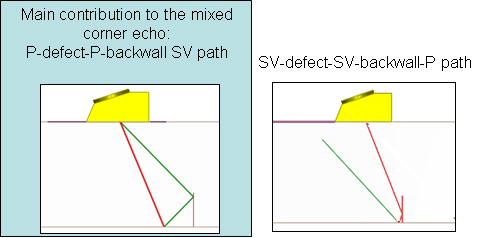
The main contribution of the mixed corner echo is the one associated with the path “P-defect-P-backwall-SV”. Indeed, the round-trip path “probe-defect-probe” associated with this mode is very favorable (cf. figure below) and the beam associated with the “SV-backwall-P path” is very strong.
The corner echo associated with the path “SV-defect-SV-backwall-P” contributes also to the mixed corner echo but provides smaller amplitude (almost -8 dB relatively to the corner echo “P-defect-P-backwall-SV”).
The figure below shows the paths associated with each of these contributions:
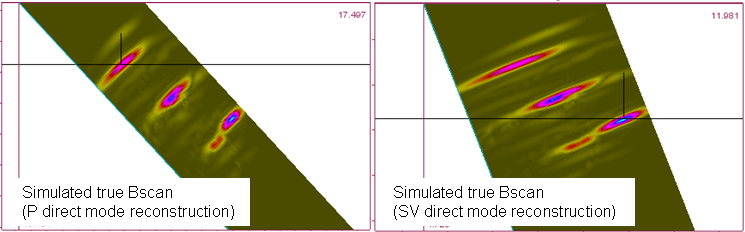
The B-scan can be reconstructed according to the P or SV waves path:
The following results are calibrated relatively to a SDH of Ø2 mm and located at 37 mm depth.
| Defect | Echo | Experimental (dB) | Simulated (dB) | Difference(dB) |
| SDH | P direct echo | 0 | 0 | 0 |
| Notch | P corner echo | 1.9 | 2.9 | +1.0 |
| Notch | Mixed mode corner echo | 4.8 | 6.1 | +1.3 |
| Notch | SV corner echo | 5.0 | 7.1 | +2.1 |
A similar configuration is studied. It involves a planar steel specimen of 47 mm thickness containing a backwall breaking notch of dimensions 10×15 mm.
The results are calibrated relatively to a SDH of Ø2 mm located at 44 mm depth. They are displayed in the table below:
| Defect | Echo | Experimental (dB) | Simulated (dB) | Difference (dB) |
| SDH | P direct echo | 0 | 0 | 0 |
| Notch | P corner echo | 2.7 | 3.6 | +0.9 |
| Notch | Mixed mode corner echo | 4.1 | 4.5 | +0.4 |
| Notch | SV corner echo | 6.3 | 8.9 | +2.6 |
There is a good agreement between experimental and simulated amplitudes of P and mixed corner echoes.
The SV corner echo amplitude is slightly over-estimated by CIVA and presents on the B-scan two main contributions. However, this has very few consequences on the main contribution since the difference is only 2 dB and because the echo is well positioned on the Bscan. As for the beam splitting phenomenon, it is studied here.
Continue to Influence of the notch height
Back to Corner Echoes with P mode
Back to Corner Echoes