
UT – TOFD : Results on Side Drilled Holes
Summary
- Configuration
- SDH echoes examples obtained for different PCS
- SDH results with P60 mode
- amplitude comparison for the P60 probe
- B-scans and echodynamic curves with the P60 probe
- A-Scans comparison for the P60 probe
- SDH ReSULTS with P45 MODE
- amplitudes comparison for the P45 probe
- A-scans comparison for the P45 probe
- Conclusion
After some generalities to describe the studied configuration, the experimental and simulated SDH defect responses obtained with different probes will be presented in this section:
| Nominal frequency | Real frequency | Crystal | Mode | Nominal refraction angle | Real refraction angle |
| 5 MHz | 4.85 MHz | Ø6.35 mm | P60 | 60° | 59° |
| P45 | 45° | 44.5° |
Configuration
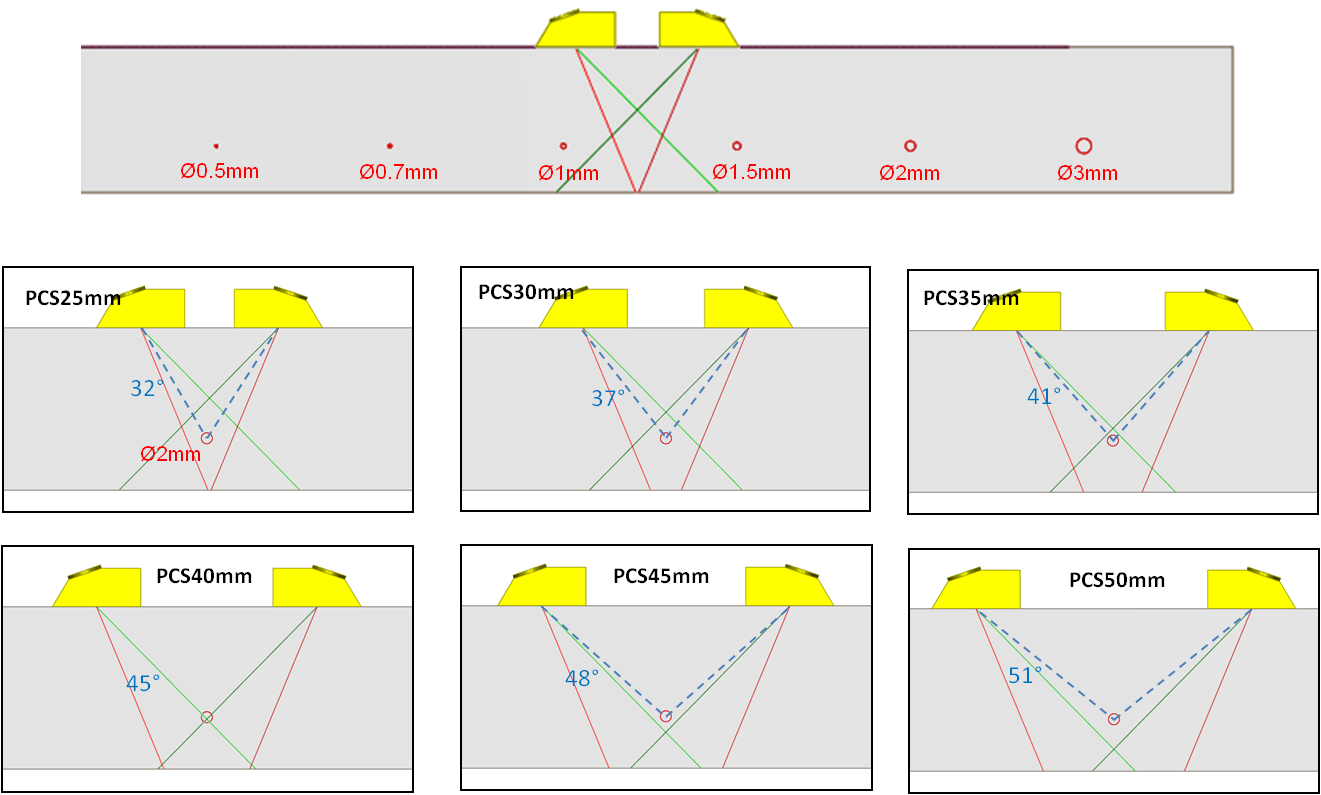
The specimen tested in this part is a plane-parallel specimen of 30 mm width. It contains 6 SDH with different diameters. An illustration is shown hereafter:
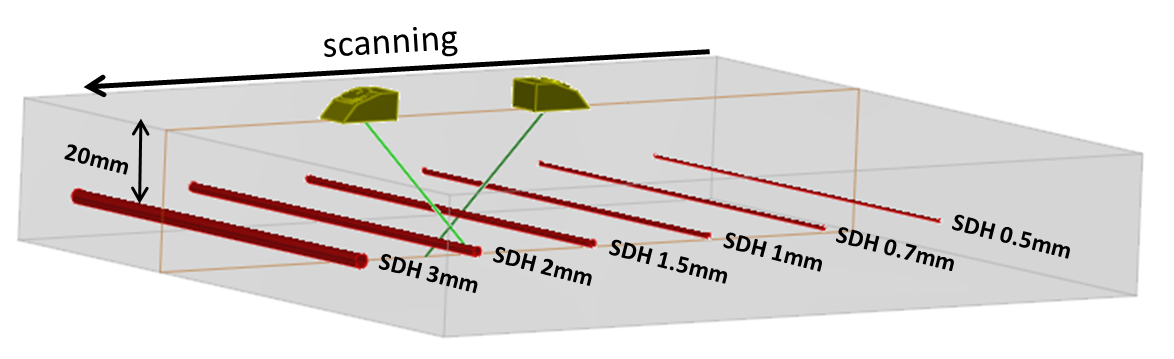
All SDH are located at 20 mm depth, SDH diameters are Ø0.5, Ø0.7, Ø1, Ø1.5, Ø2 and Ø3 mm.
TOFD inspection is performed on this specimen varying the PCS from 40 mm to 80 mm.
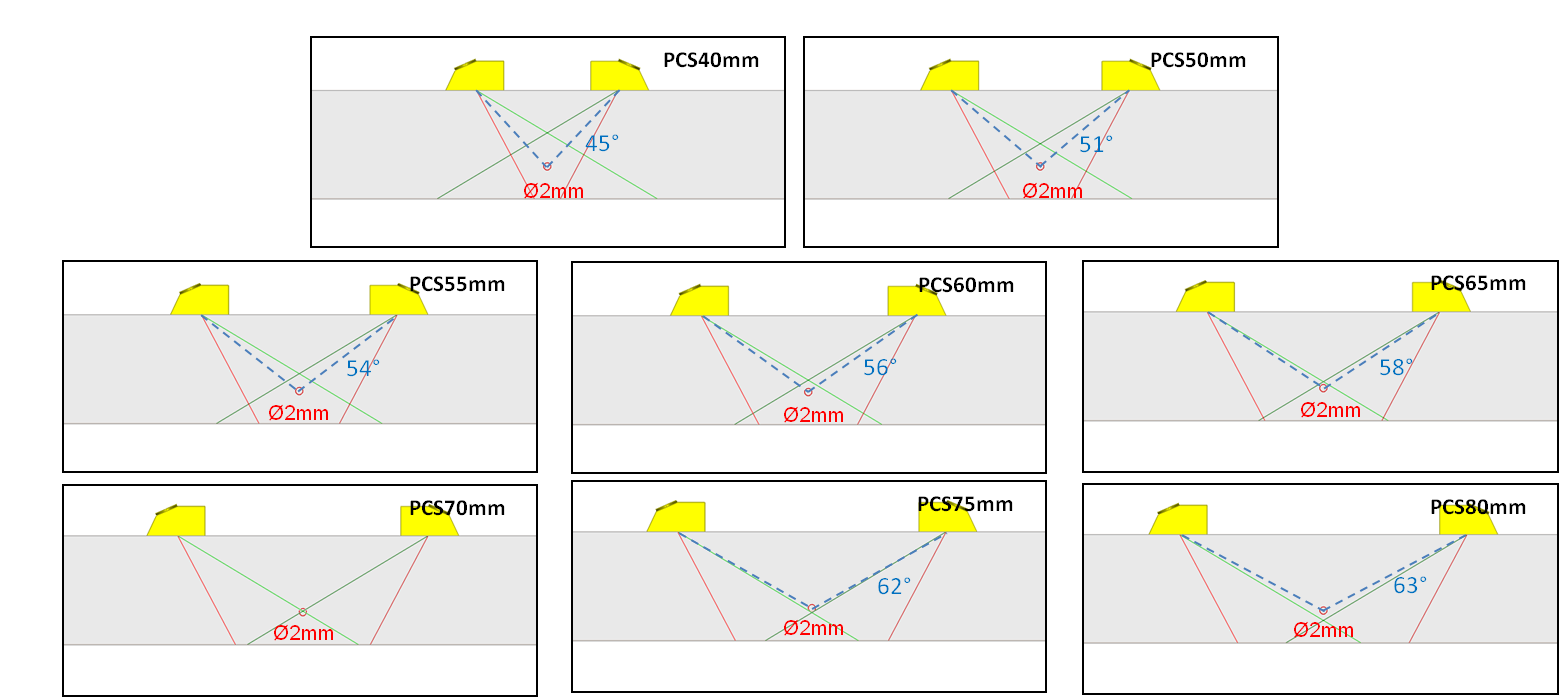
When the PCS increases, P theoretical axes of both transducers intersect first above, then below the different diameters SDH located at 20 mm depth. The crossing point is at the same depth of the SDH when the PCS is around 70 mm. Those axes, as well as the incident angles on the SDH, are represented on the following figure:
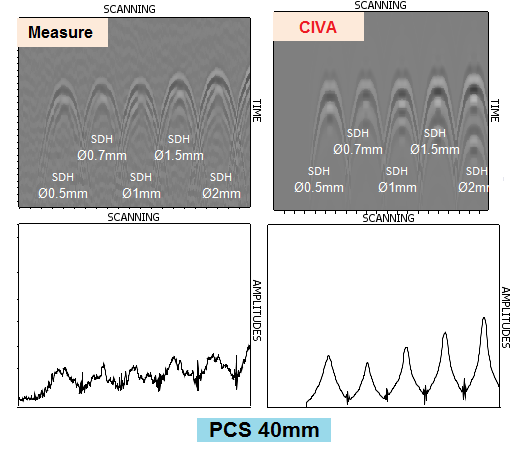
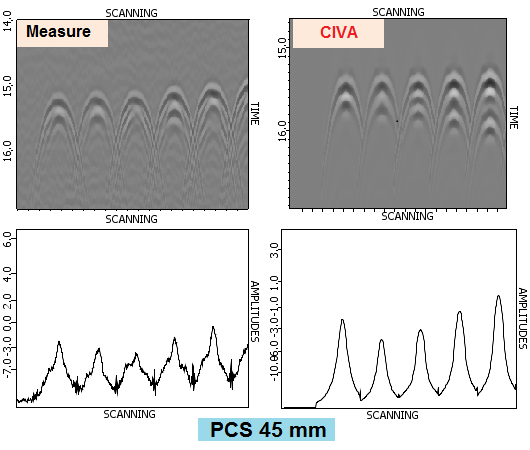
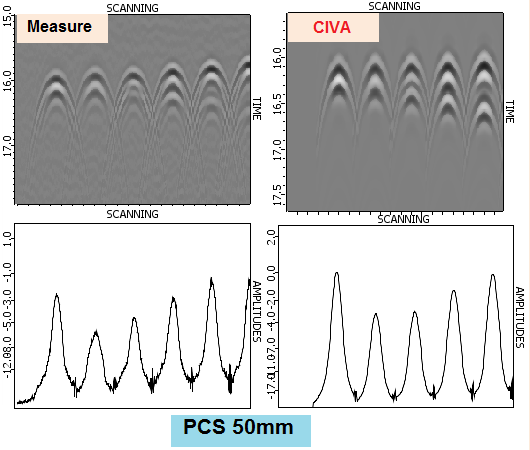
SDH echoes examples obtained for different PCS
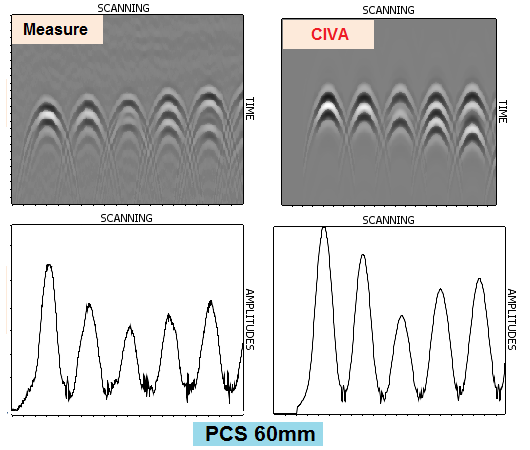
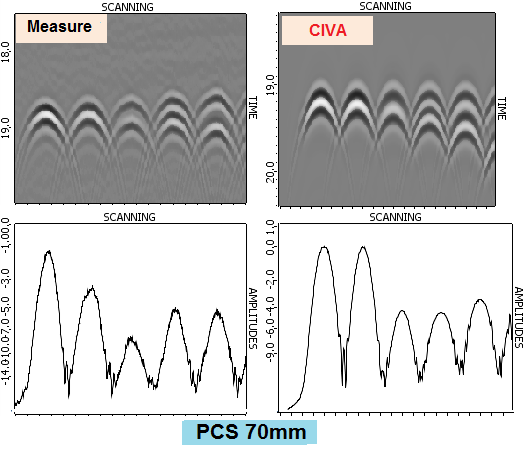
The following Ascans correspond to different PCS in the case of an inspection executed with the P60 transducer at 5 MHz:
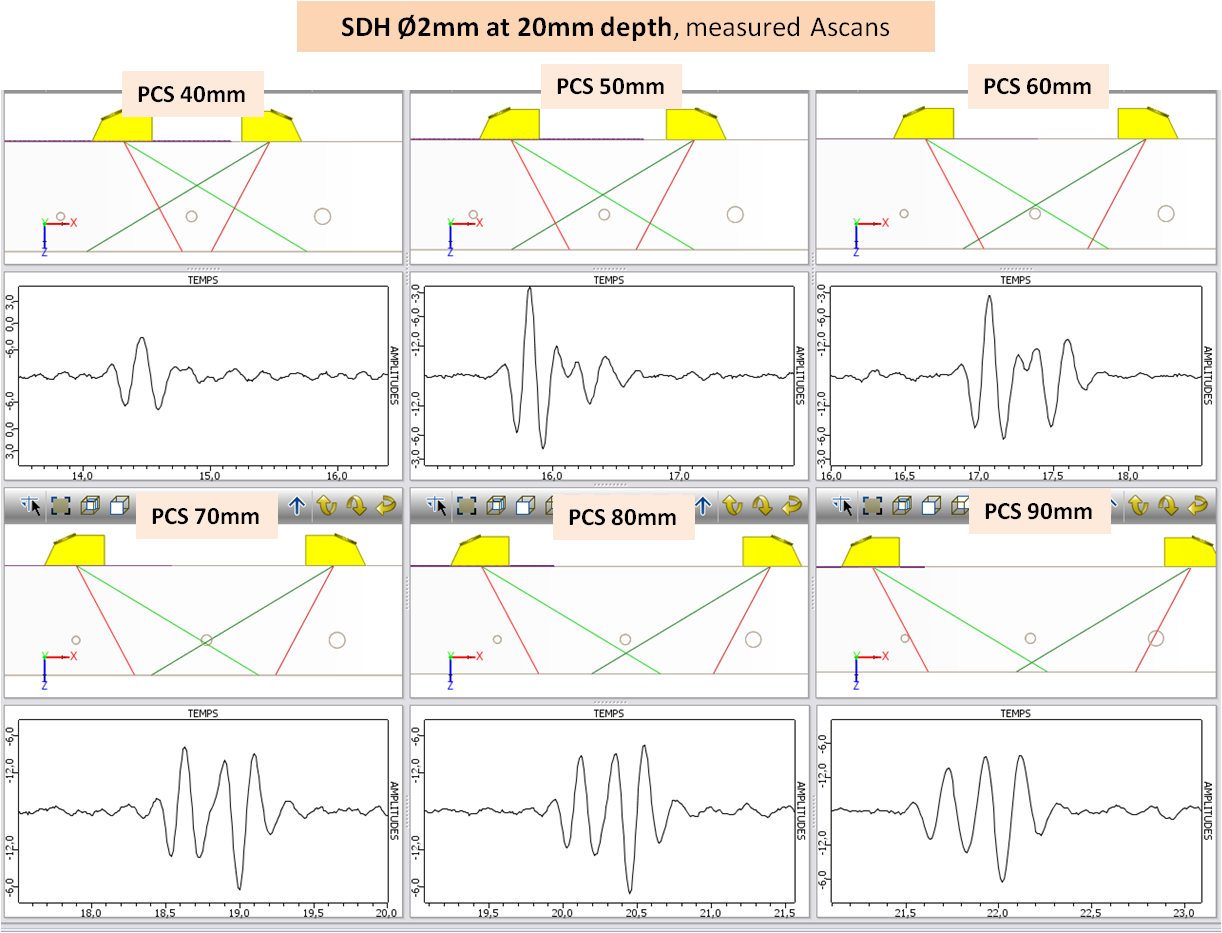
According to those results, we observe two temporally slightly shifted contributions, one corresponding to the specular reflection on the SDH, the other to the creeping wave propagating along the SDH circumference. Following phenomena are noted for this configuration.
- When the P axes crossing point is on the SDH, those both contributions are clearly distinct. Their amplitudes are similar and their phases are in opposition.
- When the P axes crossing point is above the SDH, the first contribution is bigger. The second echo amplitude first decreases (50 mm and 60 mm PCS cases), then only one echo becomes distinguishable (40 mm PCS case).
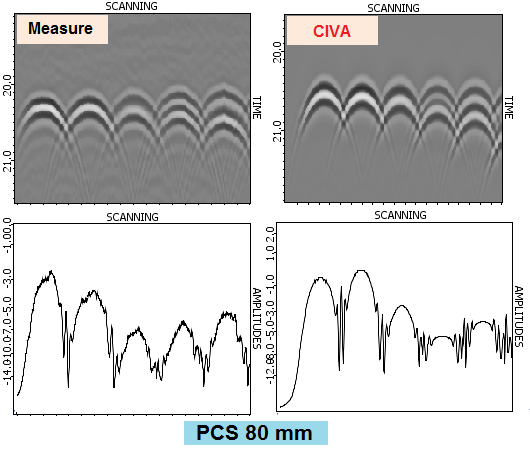
- When the P axes crossing point is below the SDH, the second contribution becomes bigger. The first echo amplitudes decreases then only one echo, spread out over the time, becomes distinguishable (80 mm and 90 mm PCS cases).
The fact that the creeping wave amplitude increases relatively to the specular wave amplitude when the PCS increases could be explained by its way around the side drilled hole which is shorter for great PCS than for the little corresponding to a weaker energy loss by irradiation along this way (cf. figure below).
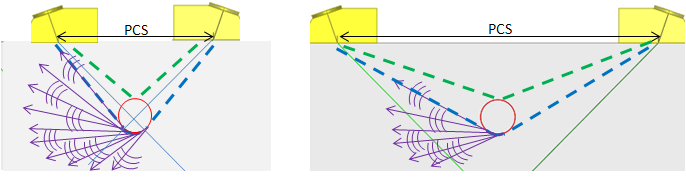
Moreover, the specular echo amplitude decreases when the “apparent” incident angle increases (with the PCS rise).
SDH results with P60 mode
For different PCS, incident angles on SDH center located at 20 mm depth versus PCS are listed in the following table. This incident angle is bigger than 60° for a PCS larger than 70 mm.
| PCS (mm) | 40 | 45 | 50 | 55 | 60 | 65 | 70 | 75 | 80 |
| Incidence angle (°) | 45 | 48 | 51 | 54 | 56 | 58 | 60 | 62 | 62 |
When the PCS increases, theoretical P axes of both probes intersect first above, then below SDH from different diameters located at 20 mm depth. The crossing point is at the same depth as the SDH when the PCS is around 70 mm (see figure below).
amplitude comparison for the P60 probe
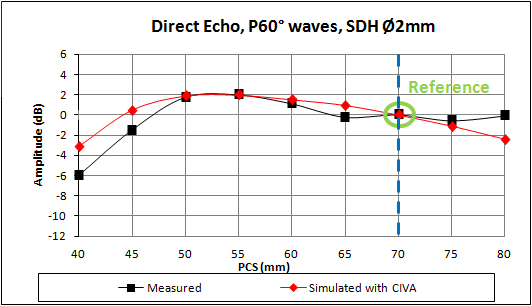
Maximal amplitude evolution of SDH echoes from 0.5 mm to 2 mm diameter located at 20 mm depth is presented versus the PCS. Experimental results are compared to simulations performed with CIVA 10.
The calibration reference in amplitude corresponds to the Ø2 mm SDH echo located at 20 mm depth obtained during the inspection with the 70 mm PCS. The doted blue line points out the PCS for which the P axes crossing point depth is 20 mm (SDH depth).
 ;
; 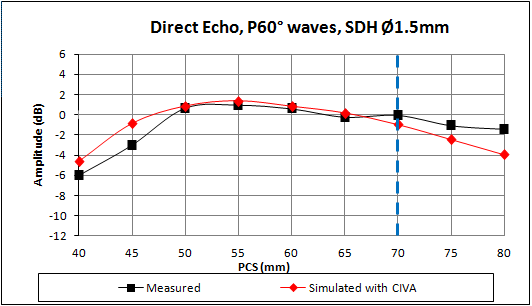
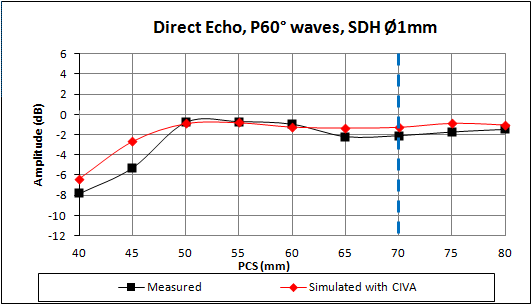
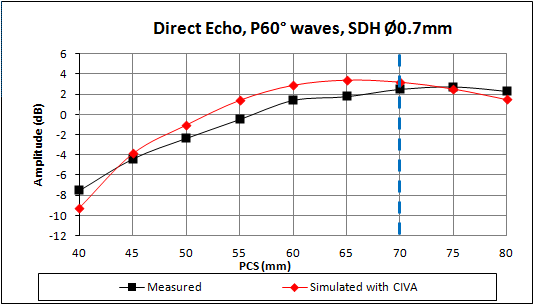
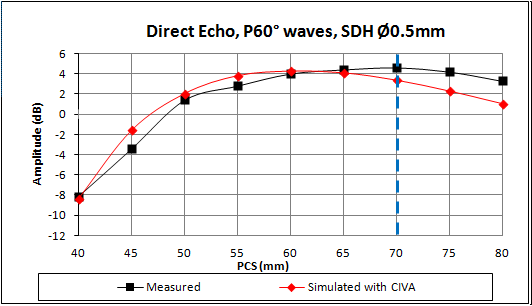
The SDH amplitude variation as a function of PCS is well predicted by CIVA. A good agreement is obtained between simulation and experiment for each SDH diameter. The maximum difference between experimental and simulated results is 2.8 dB. The table below reports the differences between experiment and simulation. These results show that the biggest differences appear for the smallest (45 mm) and the largest (80 mm) PCS.
| Experiment / Simulation discrepancies (dB) | PCS (mm) | |||||||||
| 40 | 45 | 50 | 55 | 60 | 65 | 70 | 75 | 80 | ||
| SDH diameter (mm) | 2 | 2.8 | 2.0 | 0.2 | 0.0 | 0.4 | 1.2 | 0.0 | -0.5 | -2.3 |
| 1.5 | 1.4 | 2.1 | 0.2 | 0.4 | 0.2 | 0.4 | -0.9 | -1.4 | -2.5 | |
| 1 | 1.4 | 2.6 | -0.1 | -0.1 | 0.3 | 0.9 | 0.8 | 0.9 | 0.5 | |
| 0.7 | -1.7 | 0.5 | 1.3 | 1.9 | 1.5 | 1.7 | 0.7 | -0.2 | -0.8 | |
| 0.5 | -0.2 | 1.8 | 0.7 | 1.0 | 0.3 | -0.3 | -1.2 | -1.9 | -2.2 | |
B-scans and echodynamic curves with the P60 probe
Experimental echodynamic curves obtained for PCS of 40 mm and 45 mm are very noisy (experimental results for the PCS of 40 mm were not used for comparison between experimental and simulated amplitudes).
The more the PCS increases, the more echodynamic curves are spread around the maximum amplitude (corresponding to a scanning probe position for which the beams crossing point lies vertically in alignment with the SDH). This spreading is bound to the beam’s one because of the distance between the transducer and the SDH which increases with the PCS. The figures below show the comparison between simulated and experimental measures for different PCS.
 ;
; 
 ;
;
A-Scans comparison for the P60 probe
The superimpositions of experimental and simulated Ascans of SDH whose diameters spread out from 0.5 to 2 mm with a 70 mm PCS (theoretical rays intersection) are presented hereafter. A time shift around 0.4 µs is applied before the experimental and numerical Ascans superposition. This time shift is negligible because its value is close to the measurement uncertainties.
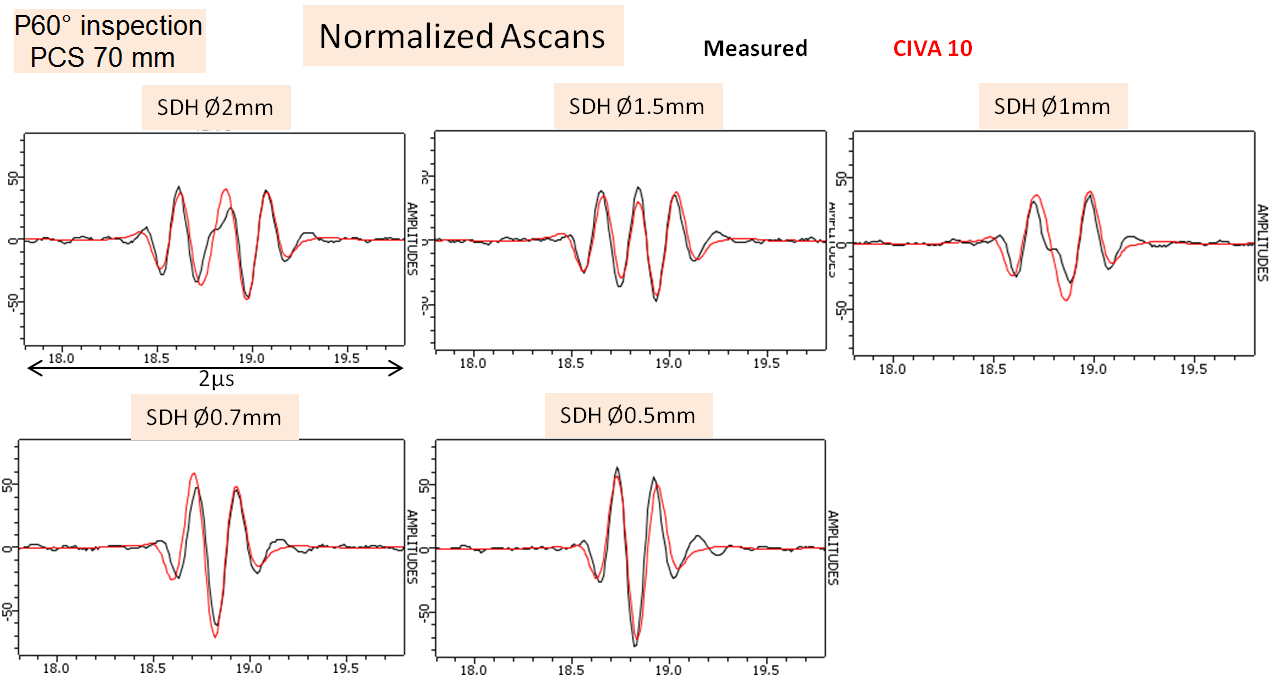
As seen previously, when the SDH diameter increases, the SDH response is splitting into 2 distinct contributions. This phenomenon is predicted by CIVA as well for the global signal shape than for both echoes relative amplitudes.
The superposition of the measured and simulated with CIVA10 Ascans of the Ø2 mm SDH located at 20 mm depth are also represented for various PCS. A time shift is applied before the measured and simulated Ascans superposition of around 0.25 µs for the 50 mm diameter PCS and of around 0.4 µs for the other PCS. Once again, this time shift is acceptable because its value is close to the measurement uncertainties.
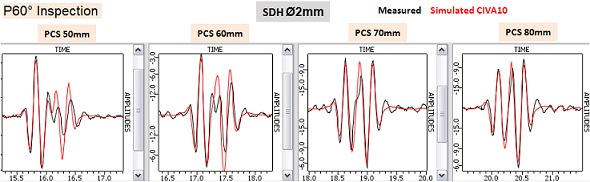
As previously, CIVA predicts the presence of 2 echoes generated by the SDH but their relative amplitudes are not always correct: in the case of the 50 mm and 60 mm PCS (P axes crossing point above the SDH) the second echo is overestimated by CIVA. When the crossing point depth is the same as the SDH depth, the amplitudes of the 2 echoes (which are similar) are well predicted.
The amplitudes obtained with CIVA10 for those Ø2 mm SDH echoes versus the PCS are in good agreement with those measured, even if the second echo amplitude is not correct, because its amplitude, weaker as the first echo amplitude, does not affect the maximal amplitude measure of the SDH echo.
SDH ReSULTS with P45 MODE
For all different PCS, incidence angles on the center of a SDH at 20 mm depth versus the PCS are listed in the following table. This incidence angle is bigger than 45° for a PCS larger than 40 mm.
| PCS (mm) | 25 | 30 | 35 | 40 | 45 | 50 |
| Incidence angle (°) | 32 | 37 | 41 | 45 | 48 | 51 |
Both probes’ theoretical P axes intersect on the different diameters SDH located at 20 mm depth when the PCS is around 40 mm. The figure hereafter illustrates those axes.
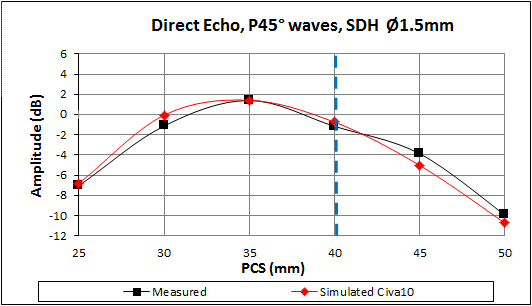
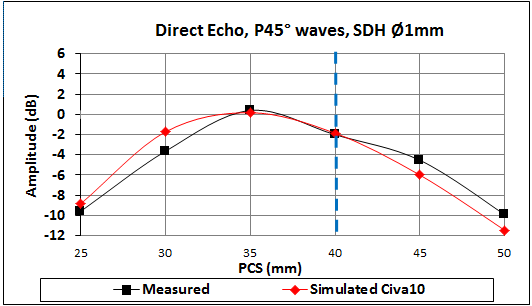
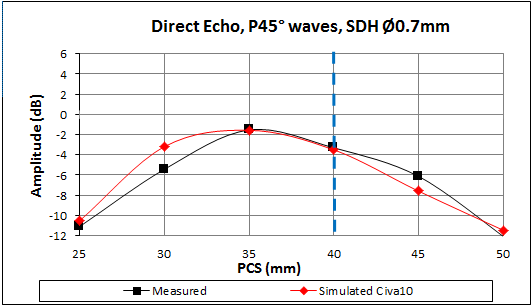
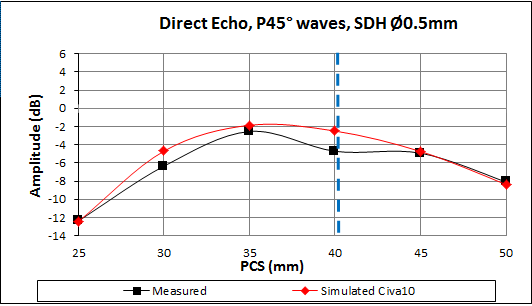
amplitudes comparison for the P45 probe
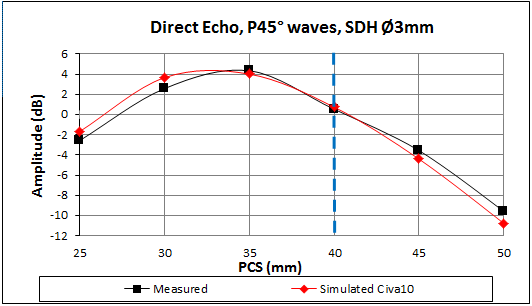
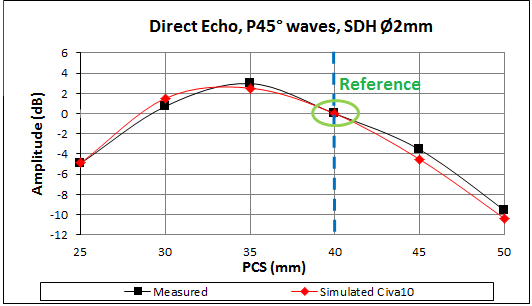
The maximum amplitudes evolution of the echoes of the SDH from 0.5 mm to 3 mm diameter located at 20 mm depth is presented as a function of the PCS. The experimental results are compared to simulations carried out width CIVA 10.
The amplitude calibration reference corresponds to the Ø2 mm SDH echo located at 20 mm depth obtained for the inspection width the 40 mm PCS. The doted blue line indicates the PCS for which the P axes crossing point depth is 20 mm (SDH depth).
 ;
; 
 ;
;
The table below synthetizes the discrepancies obtained between simulations and measures.
| Experiment /simulation discrepancies (dB) | PCS (mm) | ||||||
| 25 | 30 | 35 | 40 | 45 | 50 | ||
| SDH Diameter (mm) | 0.9 | 1.1 | -0.3 | 0.2 | -0.8 | -1.2 | |
| 2 | 0.0 | 0.8 | -0.5 | 0.0 | -1.0 | -0.8 | |
| 1.5 | 0.2 | 1.1 | 0.0 | 0.4 | -1.1 | -0.8 | |
| 1 | 0.7 | 1.9 | -0.2 | 0.1 | -1.5 | -1.5 | |
| 0.7 | 0.6 | 2.2 | 0.0 | -0.2 | -1.5 | 0.6 | |
| 0.5 | -0.1 | 1.7 | 0.7 | 2.2 | 0.2 | -0.3 | |
The amplitude evolution of different diameters SDH echo versus the PCS is well predicted by CIVA. A very good agreement is obtained between simulation and experiment for the whole SDH diameters. The maximum discrepancies between simulation and experiment reach 2.2 dB. For all SDH diameters, the experimental and simulated echo, which amplitude is the maximal, is obtained for the 35 mm PCS which corresponds to the P axes crossing point located above SDH top.
A-scans comparison for the P45 probe
The superposition of experimental and simulated Ascans of 0.5 to 3 mm diameter SDH width a 40 mm diameter (theoretical rays intersection) is presented hereafter. An about 0.2 µs time shift is applied for the measured and simulated Ascans superposition. This time shift is weaker than the measure uncertainties.
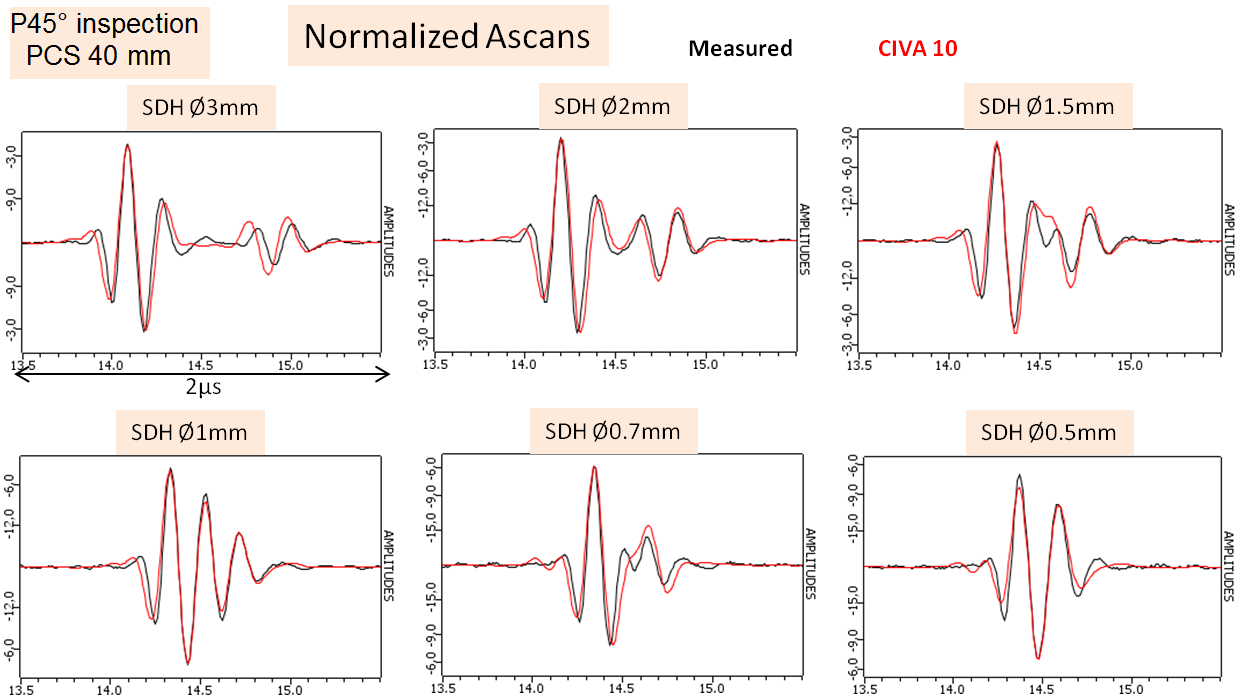
As seen previously, when the SDH diameter increases, the SDH response splits into 2 distinct contributions. This phenomenon is well predicted by CIVA for the global signal shape and for both echoes relative amplitude.
Conclusion
The goal of this study was to validate CIVA predictions for contact TOFD inspections.
The validation process begins with the validation of Side Drilled Holes responses which amplitudes are generally used for calibrations. The validation was performed on different diameters SDH and on notches of different heights. The experimental and simulated TOFD inspections were performed with contact probes working at 5 MHz and generating P45, P60 and P70 waves. All results discussed in this article have a standard bandwidth of 66%. As mentioned before, a general discrepancy is observed for probes with bandwidth larger than 80%. Although CIVA times of flight predictions are correct, amplitudes predictions are not very correlated with measurements for probes with very narrow signals.
The validation study showed that experimental and CIVA simulated results (amplitudes and times of flight) are in good agreement for SDH responses.
Continue to Results on the lower tip of a vertical notch
Back to TOFD