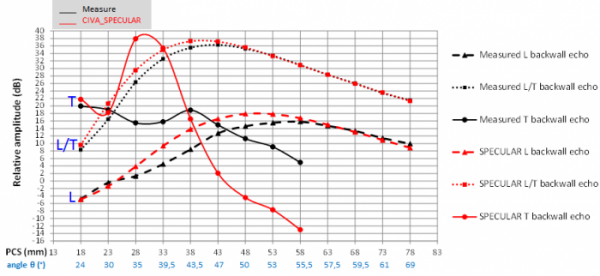
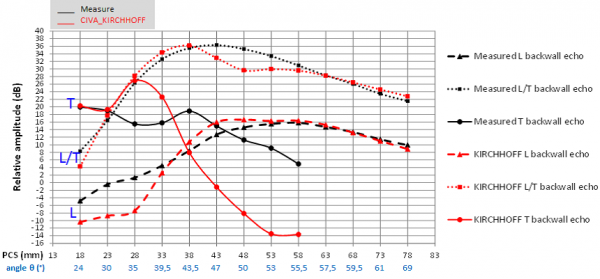
Dans cette étude de caractérisation expérimentale de CIVA US, les échos de fond expérimentaux d’une pièce plane mesurés lors d’inspection TOFD sont comparés aux prédictions des deux modèles KIRCHHOFF et SPECULAIRE. Les résultats des comparaisons et leur analyse sont présentés ici.
Configuration expérimentale et de simulation
EXPERIMENTAL SET-UP
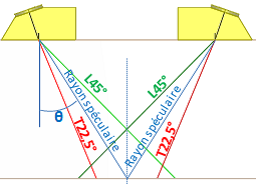
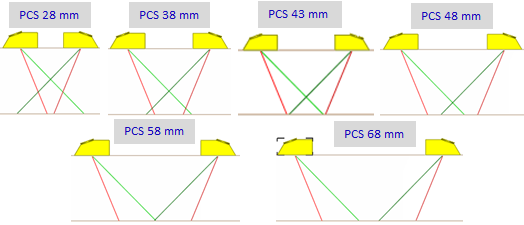
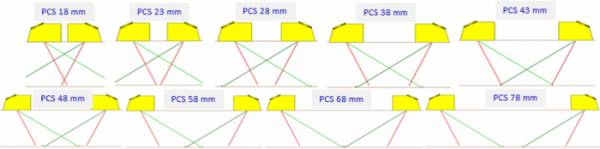
Refer to the page "PRESENTATION OF THE STUDIED CONFIGURATIONS"
SIMULATION PARAMETERS
Refer to the page "PRESENTATION OF THE STUDIED CONFIGURATIONS"
REFERENCE
In this CIVA US experimental characterization study, the experimental backwall echoes of a flat piece measured by TOFD inspection are compared with predictions of both KIRCHHOFF and SPECULAR models. Comparisons results and analysis are presented here.
| Probe | Diameter of the calibration TG | Depth of the calibration TG | PCS |
| L45° | 2 mm | 20 mm | 38 mm |
| L60° | 2 mm | 20 mm | 68 mm |
| L70° | 0.7 mm | 10 mm | 53 mm |
Comparison results
L45 probe, Ø6.35 mm, 5 MHz
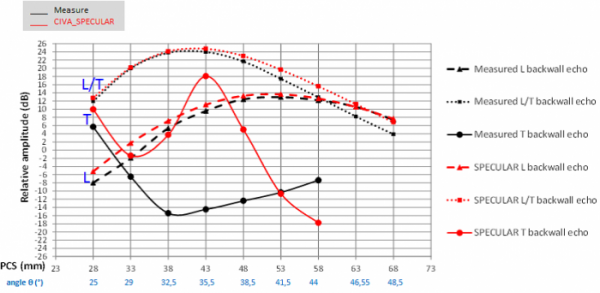
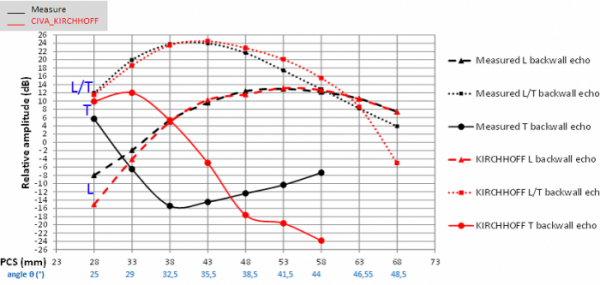
L60 probe, Ø6.35 mm, 5 MHz
L70 probe, Ø6.35 mm, 5 MHz
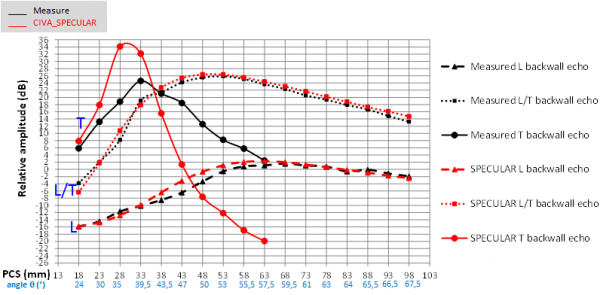
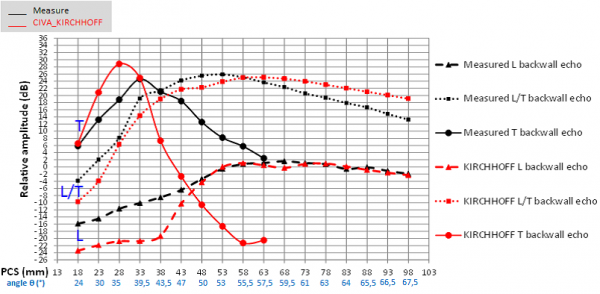
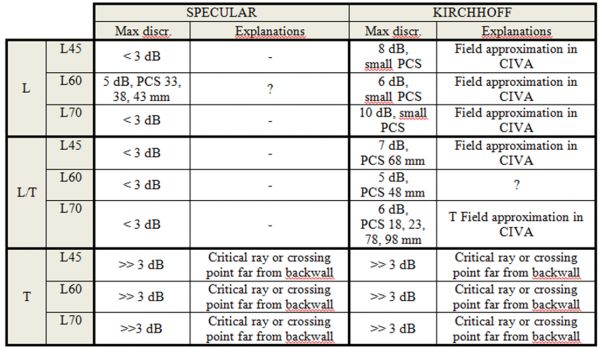
Summary of comparison results
The following table gathers the observations from the measured and simulated amplitudes comparisons. We will explain in details, later in this report, the reasons of the observed discrepancies.
Experimental A-scans
Experimental A-scans of L backwall echoes
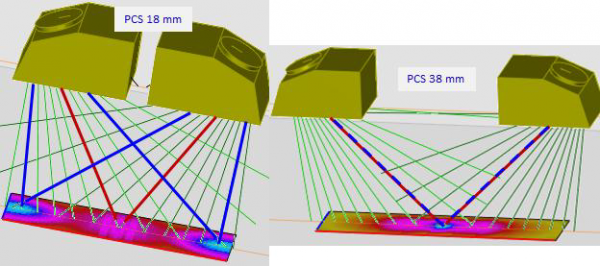
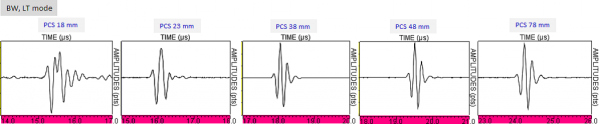
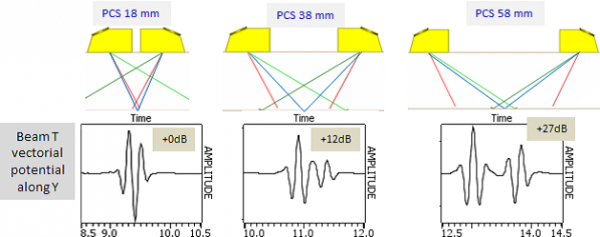
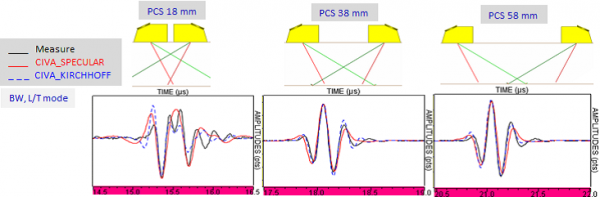
During the L60° inspection, for the small PCS, the L axis crossing point is well above the piece backwall, as it can be seen on Figure 7, and the experimental L backwall echo is temporally spread (PCS 18 mm to 38 mm Figure 13). Then, gradually as the crossing point moves towards the bottom, the echo resolves in time and approaches the purple line indicating the L waves sound path along the specular ray.
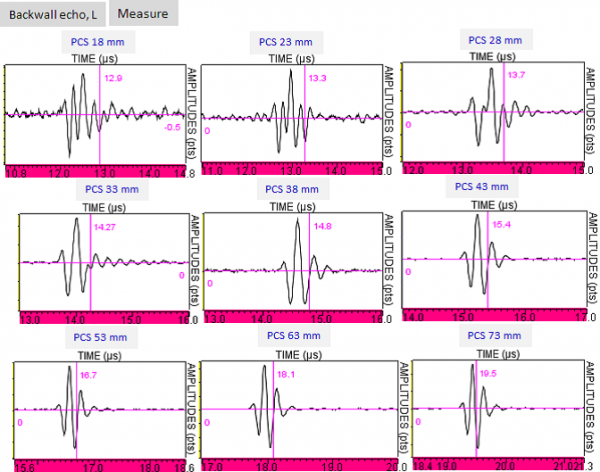
The spreading of the L backwall echoe A-scan for the small PCS can be interpreted in a simplified way considering the rays propagation contributing to the L echo. These rays, as well as the incident L fied in transmission/reception to the specimen backwall are drawn Figure 14 in the case of the L60° inspection for the 18mm PCS (for which the backwall echo is temporally spread) and 38mm (L backwall echo temporally resolved). The red rays on this figure are the specular rays while the blue one corresponds to rays for which the field amplitude on the piece backwall is maximal. Both “types” of rays particularly contribute to the echo, either because of their specular path for the red rays, or because of the high amplitude of the blue rays. It can be seen, that, in the case of the 18 mm PCS, the red and blue rays are very far from each others, what explains the backwall echo spreading as the rays contributing to this echo are temporally spread between the red and blue times of flight, as they arrive at the receiver surface. While in the case of the 38 mm PCS, as the blue and red rays are mingled, the rays contributing to the L backwall echo arrive simultaneously.
Experimental A-scans of L/T backwall echoes
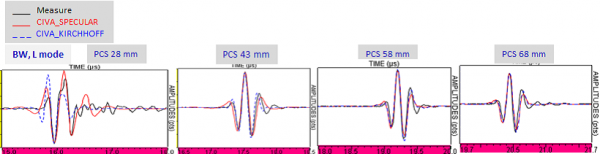
The experimental A-scans of the LT backwall echoes obtained during the L60° inspection are presented Figure 15 for PCS from 18mm to 78mm. The A-scan is temporally spread at the PCS of 18mm, then it is temporally resolved from the PCS of 23mm. The interpretation done above for the L backwall echoes can certainly be applied here as well, but it is more difficult to illustrate because the specular path is not unique in this case.
Experimental A-scans of T backwall echoes
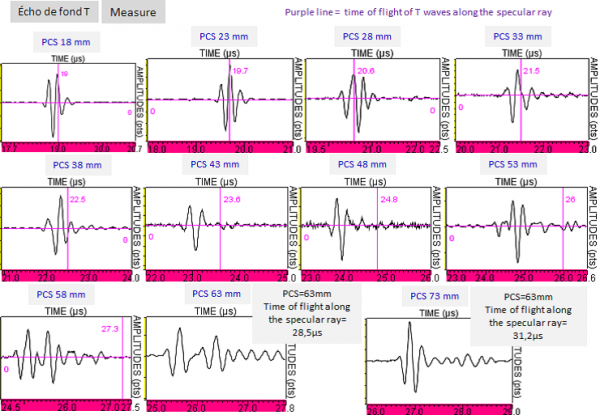
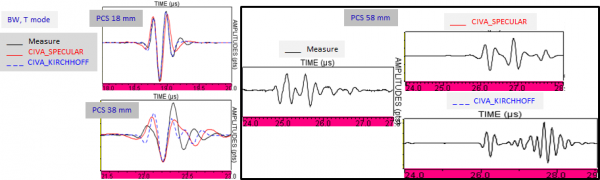
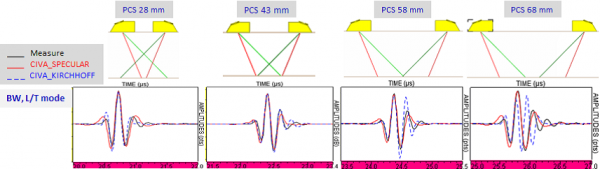
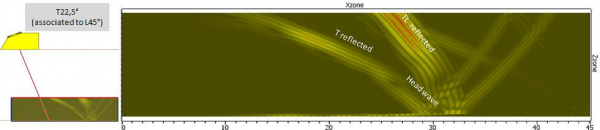
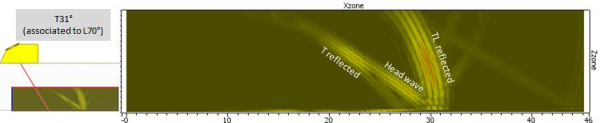
In the case of L60° TOFD inspection, experimental A-scans of the T backwall echo are presented Figure 16 for PCS from 18mm to 73mm. The time of flight indicated with the purple line on each A-scans corresponds to the T waves sound path along the specular ray defined Figure 3 (for the A-scan at the 63 mm PCS this sound path is equal to 28.5μs and the purple line doesn’t appear because it is out of the temporal window). In the PCS from 18 mm to 33 mm, the experimental T backwall echo arrives nearly at the T waves sound path along the specular ray. For greater PCS, the T backwall echo arrives earlier and temporally spreads more and more as the PCS increases and the T axis crossing point moves away from the specimen backwall (Figure 7).
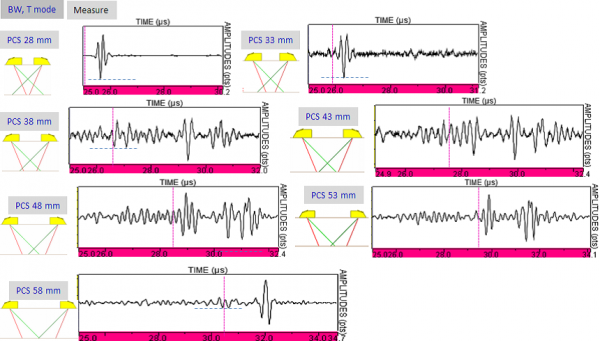
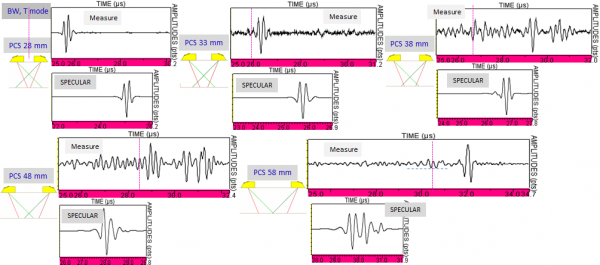
In the case of L45° inspection, T backwall experimental A-scans are presented Figure 17 for PCS from 28 mm to 58 mm. In the case of PCS from 28 mm to 33 mm, the experimental T backwall echo arrives at the sound path along the specular ray (considering the time of flight uncertainty). But for the greater PCS, the T axis crossing point moves away from specimen backwall and many contributions appear around this time of flight. The T backwall A-scan spreading for great PCS and its complex shape can be interpreted by a simplified way as it has been done for the L backwall echoes:
- - By the time of flight difference between both rays types contributing to the echo which are: specular rays and rays which present strong field amplitudes at the backwall of the piece.
- - By the temporal shape of the T field emitted on the specimen backwall at the level of specular rays, which is more temporally spread as those rays move away from the probe T axis as it is the case when the PCS increases (Figure 18).
Moreover, head waves created on the specimen backwall and propagating in the piece towards the receiver can contribute to the A-scans complexity.
Analysis of comparison results
- The beam approximation done in CIVA for the computation of the interaction between the incident beam and backwall (only for Kirchhoff model).
- Critical T rays on the specimen backwall (KIRCHHOFF and SPECULAR).
- The beam computation which is not valid far from the probes (KIRCHHOFF and SPECULAR).
These 3 reasons are developed in the following paragraphs.
Approached beam description (KIRCHHOFF model)
L BACKWALL ECHOES
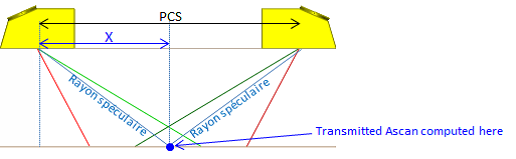
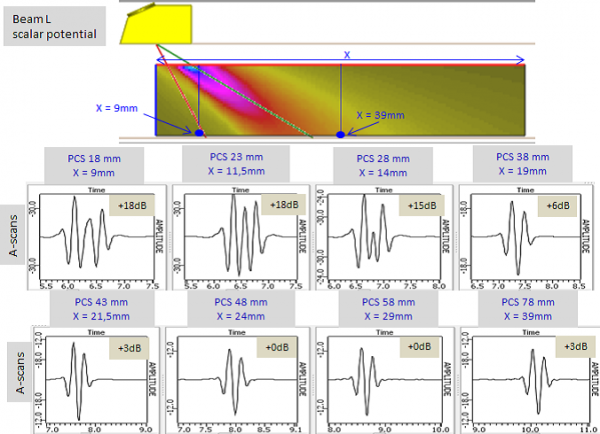
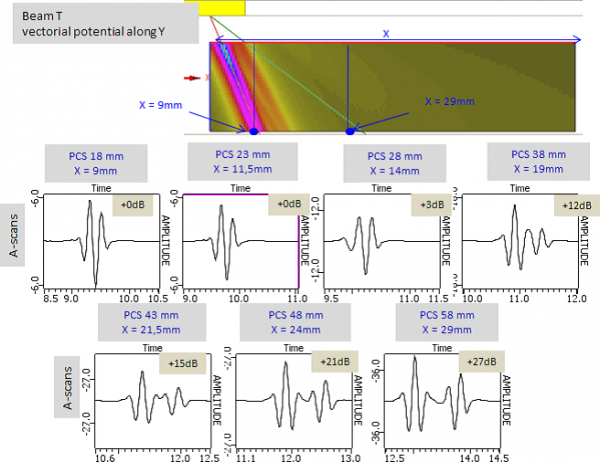
As it has been written earlier, for the computation of the specimen backwall with KIRCHHOFF model, the field of each probe is described in an approximated way by a temporal shape, an incidence direction, amplitude, a phase and a time of flight. This approximation is not valid anymore for backwall parts that are very far of the crossing point because in this case the temporal shapes of the beam emitted on the backwall are spread as it is illustrated Figure 20: on this figure is represented the A-scans of the L60° beam emitted on the backwall of the piece at a X distance from the probe crossing point equal to the half PCS and also corresponding to the beam at the level of the impact point of the specular ray on the specimen backwall for this PCS (Figure 19). Those A-scans show that the L beam emitted on the specimen backwal far from the L waves refracted axis is temporally spread (X=9 to X=14mm); the approached description done for the backwall echoes computation is also not valid anymore. Then, more the A-scans are extracted close to the L axis, the more they are resolved in time. This interpretation is of course simplified because the field associated to the specular ray is not the only one that contributes to the L backwall but to all rays arriving on the main part of the specimen backwall which contribute to the echo.
T BACKWALL ECHOES
As for L backwall echoes, the approached description of the T beam used for T backwall echoes computation with KIRCHHOFF model leads to false amplitudes and A-scans when the T waves crossing point is located far from backwall. The A-scans of T field emitted on the piece backwall are also temporally spread (this is the case for example at great PCS for the Ø6.35mm probe, 5MHz, L60°, Figure 26).
But this approached description is not sufficient in itself to explain discrepancies between measured and with KIRCHHOFF and SPECULAR models simulated amplitudes. Critical rays and also bad prediction of CIVA beam far from T probes axis (described in following paragraphs) are as well responsible to those great discrepancies which clearly appear on A-scans of Figure 24 and Figure 25 (only SPECULAR A-scans).
L/T BACKWALL ECHOES
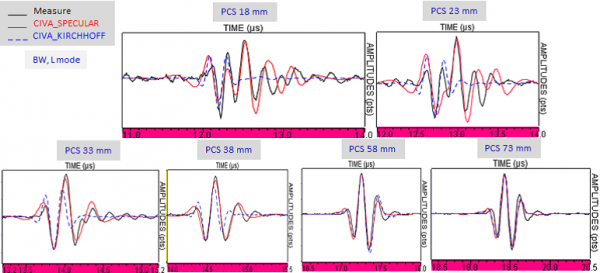
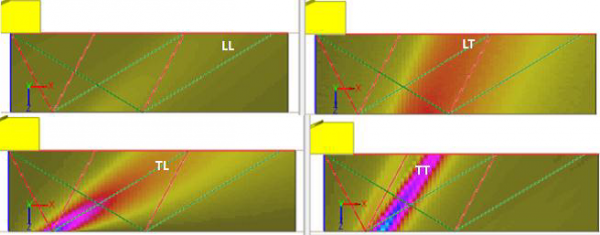
Here again, the lack of pertinence of the beam approached description done for LT echoes computation with KIRCHHOFF model certainly explains the discrepancies between the measured and with KIRCHHOFF model simulated amplitudes and A-scans when the A-scans of L or T beams on specimen backwall are temporally spread, as it is the case for L beam at little PCS and for the T beam at great PCS (Figure 26 et Figure 27). The SPECULAR model, which doesn’t use this approach beam description, well predicts LT backwall echoes A-scans for all PCS (Figure 26 and Figure 27).
Critical T rays
The amplitudes of the T backwall echo simulated with with KIRCHHOFF and SPECULAR models are widely overestimated with respect to the measurement (up to more than 20 dB) at the PCS for which the specular ray incidence angle on specimen backwall is close to the 33° critical angle; KIRCHHOFF and SPECULAR models don’t correctly predict amplitudes for rays contributing to this echo whose incidence angle on piece backwall is close to the critical angle and don’t take into account the contribution of the head wave and its interaction (that can, depending the cases, be constructive or destructive) with specular rays. Also, even at the PCS for which there is no T backwall echoes prediction error caused by the beam approximation (case for which the T axis crossing point of probes is close to the piece backwall), others errors, bounded to critical incidence rays contributing to the echo, can appear. This is the case for example of the 28 mm PCS for the L70° inspection: more than 14 dB discrepancy between measure and SPECULAR and more than 8 dB between measure and KIRCHHOFF.
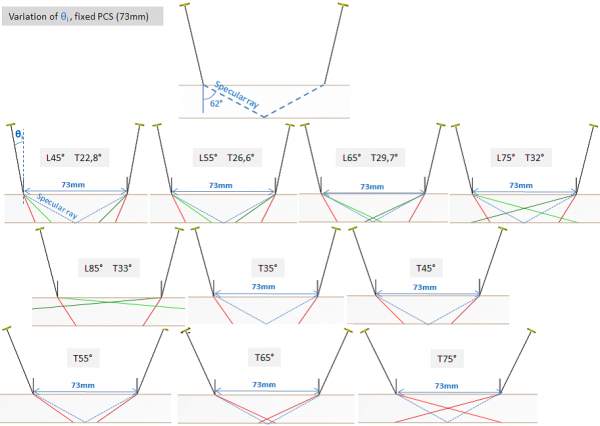
To verify the validity of this interpretation, T backwall echoes complementary measurements have been carried out in such configuration that, when T probes axis cross over near the piece backwall, specular angles incidence angles on piece backwall are far from the critical angles. Those measurements are realized with immersion probes of same diameter and central frequency of contact probes (Ø6.35mm and 5MHz). During inspections, PCS and water path were maintained constant: respectively 73 mm and 50 mm. Only the probes incidence θ angle (as defined on Figure 28) varied from 10.2° to 26.3° in order to create in the piece L waves from 45° to 85°, then T waves from 35° to 75°. Thus, for all those inspections, specular ray is the same and its incidence angle on specimen backwall is 62° (Figure 28 on top), very far from the critical angle. Critical angles contributing to T backwall echoes for those inspections should not appear.
The amplitudes of L, T and LT backwall echoes are compared to those predicted by SPECULAR model (Figure 29) and by KIRCHHOFF model (Figure 30). The results of those comparisons confirm that both models don’t predict anymore T backwall echoes amplitudes widely over evaluated with respect to the measure as it was the case for previous inspections when specular rays incidence angles on piece backwall were close to the critical angle. The amplitudes overestimations of previous inspections are also due to critical rays presence.
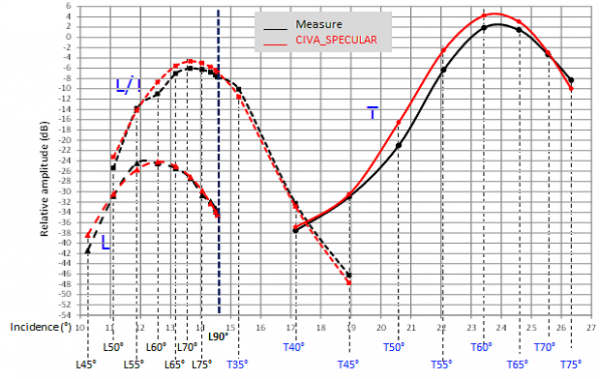
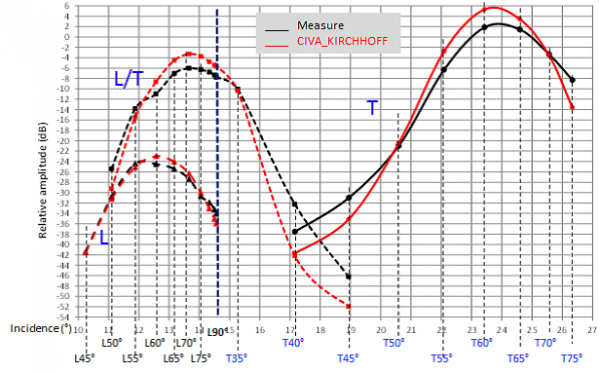
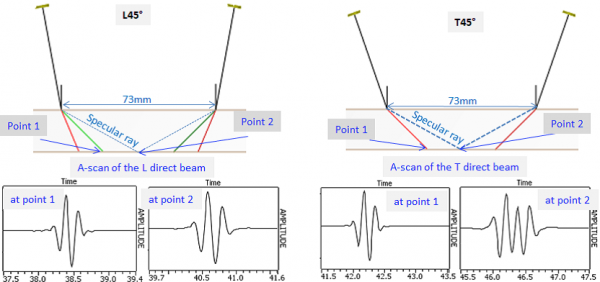
Furthermore those results show that, for T40°, T45° or T75° waves refraction angles in the specimen, LT and T backwall echoes amplitudes predicted by KIRCHHOFF model are widely under evaluated (up to 10 dB). These discrepancies are attributed to the approached beam description which is not valid for those configurations. Indeed, Figure 34 shows that the distance between points 1 (on L or T probe axis) and 2 (on the specular ray) is identical for both L45° and T45° inspections, T beam at point 2 is very different from T beam at point 1, what is not the case for L beam. Thus, the beam approached description, valid for L45° inspection, is not for T45° inspection and the T backwall echo amplitude is under evaluated by around 4 dB for KIRCHHOFF model (Figure 30).
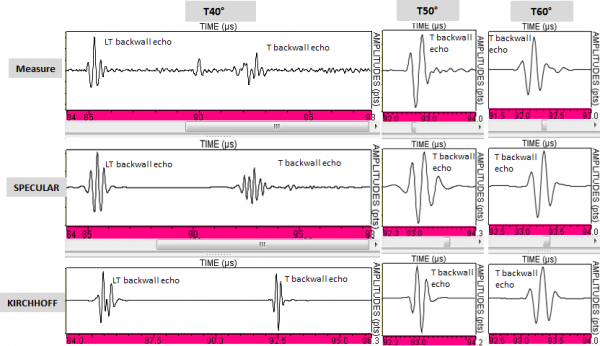
We also have compared on Figure 35 measured and simulated A-scans of LT and T backwall echoes obtained for T40° inspection (T axis crossing point far from backwall), T50° and T60° (T axis crossing point close to backwall.
In the T50° and T60° cases, measured A-scans and with KIRCHHOFF and SPECULAR models simulated A-scans are similar, as the amplitudes were similar on Figure 29 and Figure 30.
In the T40° case:
- it has been seen Figure 29 that the T backwall echo amplitude obtained with SPECULAR model is close to the one measured, but the A-scan is different. It can be furthermore noted that the LT backwall echo A-scan is quite good predicted.
- it has been seen Figure 30 that the T backwall echo amplitude obtained with KIRCHHOFF model is far from the one measured; as the A-scan is as well far from the one measured (in time of flight and in amplitude). It can be furthermore noted that the LT backwall echo A-scan is false too.
It can be said that generally the T beam of L45°, L60° and L70° probes emitted in the specimen and reflected on the backwall are complex because of the critical rays presence on surface and backwall specimen. When the beam is computed with CIVA:
-
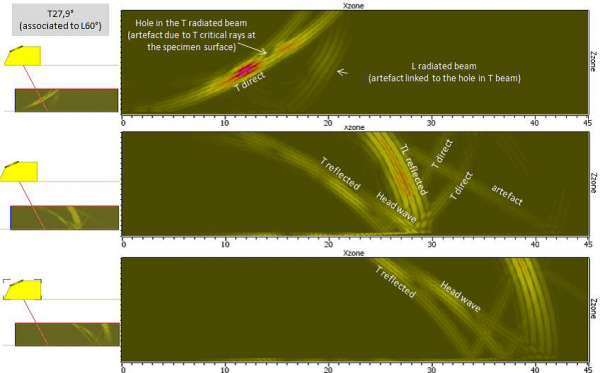
- On the specimen surface, the critical rays are responsible of an energy drop in the T beam radiated in the piece around the 33° critical angle related to the coefficients values associated to these rays which is not realistic (Figure 33 on top). Moreover the head wave, whose contribution attenuates this radiated energy drop in the reality, is not taken into account in CIVA.
-
- By the same way on specimen backwall, the critical rays create creeping waves which radiate in the piece head waves with an amplitude similar to the T reflected waves amplitude (Figure 33 center and bottom). Those waves are not taken into account during T echo calculation with CIVA.
Thus, those complex phenomena radiated to critical rays can cause errors during T backwall echoes computation.
Beam not correctly predicted far from probes axis
The differences between the amplitudes of the measured and with the SPECULAR model simulated T backwall echoes at θ angles greater than the critical angle of 33 ° may be due to the T field emitted on the echogenic area on piece backwall that is poorly predicted by CIVA as this area is far from the T sensors axis. Indeed, the diffraction phenomena of the sensor are taken into account in an approximate way when calculating L (T) field that radiates into the piece and this would lead to a prediction of the field even more false than the L (T) field is calculated far from the axis L (T) of the sensor. Thus, the higher the emitted field at the bottom is spatially resolved, the faster it is poorly predicted by CIVA when it moves away from the axis. But for those inspections, the width of the focal spot of the T field is much smaller than the one of the L field on backwall (See Figure 36, L60 ° inspection case). The discrepancies observed between the amplitudes of the measured and with the Kirchhoff model simulated T backwall echoes at θ angles greater than the critical angle can be explained in the same way and can be added to the gaps caused by the approximate description of the invalid field in these cases.
Conclusion
-
If the probes axis crossing points is sufficiently close to specimen backwall
-
And, in the case of T backwall echoes, if the T rays angle contributing to the echo are incident to the specimen backwall at not critical angles.
In other cases, discrepancies, sometimes very important for T backwall echoes, have been obtained between measured and by CIVA predicted amplitudes. They are most of the time explained by:
- The beam approximation done in CIVA for the computation of the beam interaction on piece backwall. This approximation, only done with KIRCHHOFF model, is not valid when backwall echogenic areas are close to the probe and/or far from probes axis.
- And/or the critical T rays presence on specimen backwall. The contribution of these rays to T or LT backwall echoes on specimen backwall is not correctly evaluated by CIVA, moreover they create creeping waves on specimen backwall which can contribute to make the experimental T backwall echo very complex and which are not taken into account by KIRCHHOFF and SPECULAR models of CIVA.
- And/or the field that is not correctly predicted by CIVA at backwall echogenic areas which are far from the probes axis. The reason is a simplified consideration of the vibration of single elements crystals during the beam computation.
Not explained discrepancies remain in the L60° case at 33, 38 and 43 mm PCS for which the SPECULAR backwall echo is under estimated with respect to the measure. Those backwall echoes experimental characterization results let appear known limitation of KIRCHHOFF and SPECULAR models of CIVA (beam approximation with KIRCHHOFF model, critical rays contribution poorly evaluated, creeping waves not taken into account). But they also showed a limitation of the beam calculation which would be not correctly predicted by CIVA in areas far from probes. The effects of this limitation have not been pointed out during previous experimental characterization studies which didn’t consider echogenic areas far from probes axis, as it is the case here, where reflector have very great dimensions (specimen backwall) in TOFD mode (configuration encouraging the contribution of specular rays to backwall echoes which are very far form probes axis).
Continue to Results on lateral waves
Back to TOFD