
UT – TOFD : Results on lateral waves
Summary
In this study of experimental characterization of the lateral wave, different pairs of contact transducers with a bandwidth around 60% are used to study the effect of the probes incidence angle and of the distance between them on the contribution of the lateral wave.
Experimental and simulation settings
Experimental set-up
Refer to the page “PRESENTATION OF THE STUDIED CONFIGURATIONS”
Simulation parameters
Refer to the page “PRESENTATION OF THE STUDIED CONFIGURATIONS”
Reference
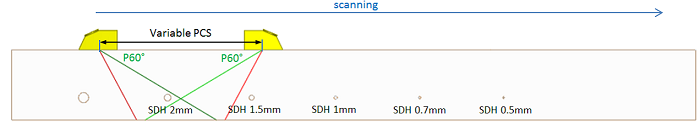
The reference amplitude is the maximum amplitude of the L direct echo of a Side Drilled Hole (SDHref) measured for a given value of PCS. The PCS depends on the probes and is specified for each couple of transducers. The SDH of reference is located in a 30mm height rectangular specimen made of ferritic steel containing 6 SDHs (diameters between 0.5mm and 3mm) located at 20mm depth (Figure below).
Results
Time of flight of the lateral wave
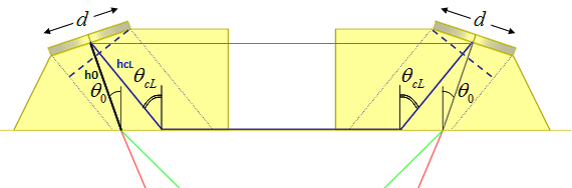
The time of flight of the lateral wave can be calculated approximatively by following, from the center of the transmitting probe, the ray path which propagates:
- In the wedge at the critical angle θcL on the distance hcL with L wave velocity
- Then, on the distance « D » located on the specimen surface with L wave velocity
- Then, in the wedge of the receiving probe with LW velocity on the distance hcL until the center of the crystal of the receiving probe (cf. Figure below describing the case of probes which incidence angle is θ0 and with wedge height equal to h0) :
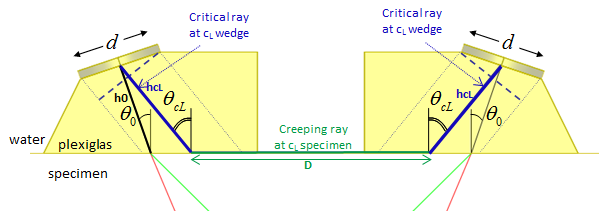
Example: for LW70° TOFD inspections, the critical incidence for L waves on the interface Plexiglas/steel is θcL=27.56°.
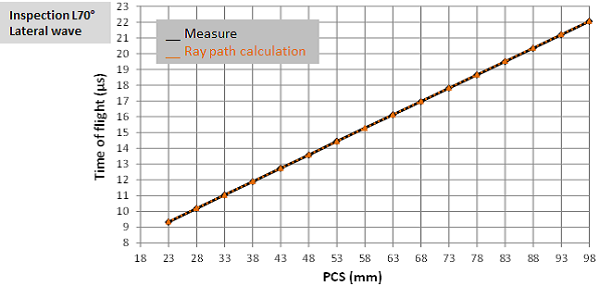
The incidence angle of the L wave axis in the wedge is θ0=25.77° and the water path is h0 = 7.34mm. The time of flight time calculated according the indications of the previous figure are very close to the times of flight measured on the experimental lateral wave (Figure below).
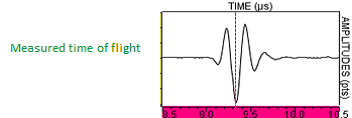
NB: The experimental time of flight of the figure above are extracted at the point of minimal amplitude (negative alternation) (cf. Figure below).
Temporal spreading of the lateral wave
The more the probe incidence angle θ0 is distant from the critical angle of the L waves incidence (θcL), the more the contribution of the lateral wave is spread out over time. The spreading is observed around the time of flight associated with the critical ray path from the center of the transmitting probe and arriving at the center of the receiving probe. The duration of this spread is evaluated in “2D” by calculating the phase difference between the rays from the two “edges” of the probe (Figure below). This duration for the transmitter (or receiver) is equal to:
Δt = d sin(θ0 – θcL)/V0
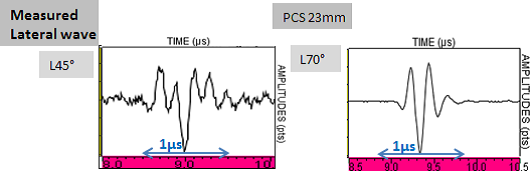
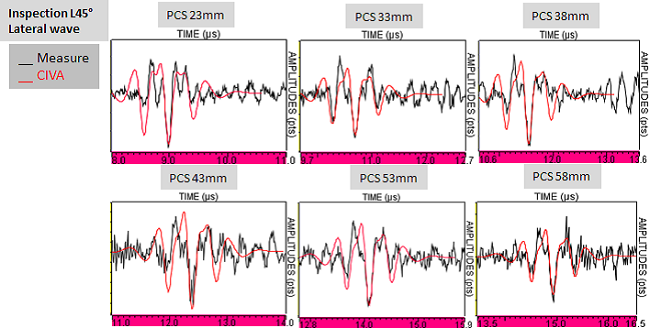
The temporal spreading of the lateral wave is weak for LW70° inspections (≈0.15 µs) but it is larger for LW45° inspections (0.7 µs). This difference of spreading can be noticed on experimental A-scans of the lateral wave obtained at PCS = 23mm (see figure below).
Amplitude of the lateral wave
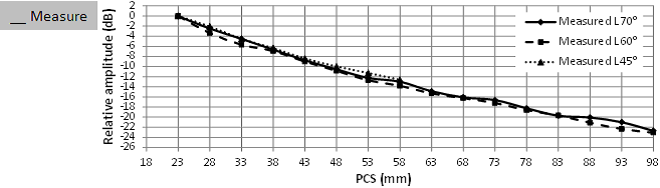
The figure below shows the amplitude variation of the experimental lateral wave according to the PCS for LW45, LW60 and LW70 inspections. The 0dB is obtained by choosing as reference the maximum amplitude of the lateral wave measured for PCS=23mm. It can be seen that the decrease of the lateral wave amplitude is the same for LW45, LW60 and LW70 inspections.
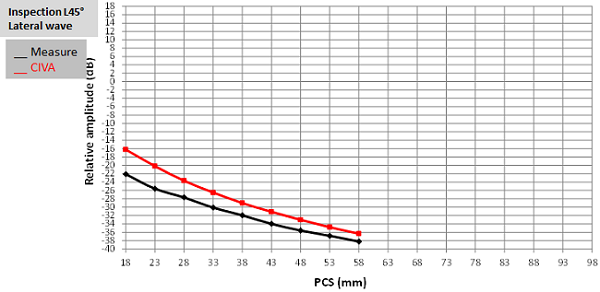
The reference amplitude for simulation / experiment comparison was changed for each couple of probes. Thus, for the LW45 inspection, the reference amplitude is the maximum amplitude of the L direct echo of a SDH of 2mm diameter (SDH Ø2mm) located at 20mm depth and measured when the PCS is 38mm (PCS for which the amplitude of reference corresponds to the maximum of amplitude of the L direct echo of a SDH). The comparison of experimental and simulation results is presented on the figure below.
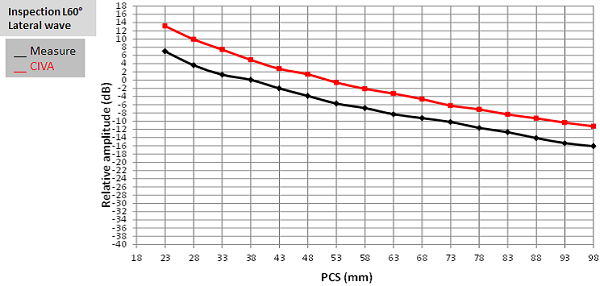
For LW60 inspection, the reference amplitude is the maximum amplitude of the L direct echo of a 2mm diameter SDH located at 20mm depth when PCS=68mm (PCS for which the amplitude of reference corresponds to the maximum of amplitude of the L direct echo of a SDH). The results of the comparison are shown on the figure below.
For LW70 inspection, the reference amplitude is the maximum amplitude of the L direct echo of a SDH of 0.7mm diameter located at 10mm depth. This amplitude is obtained when the PCS is 53mm (PCS for which the amplitude of reference corresponds to the maximum of amplitude of the L direct echo of a SDH). The results of the comparison are presented on the figure below.
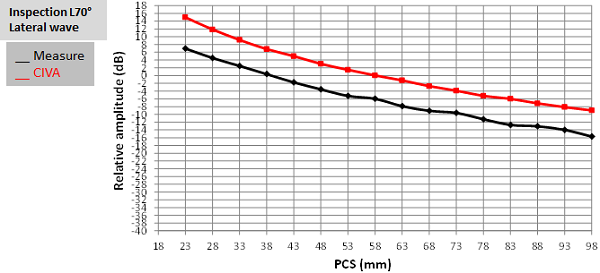
The comparison of simulated and experimental amplitudes shows that for LW70 and LW60 inspections and whatever the PCS, simulated amplitudes are overestimated (from +5 to +7 dB) compared to the experience. For LW45° inspections, CIVA amplitudes are 6dB higher when the PCS is 18mm, and 2 dB higher when the PCS is 58mm.
The differences between the experimental and simulated amplitudes of the lateral wave are presented on the figure below. However, the absolute value of the simulated amplitude relatively to the one of a reference defect is overestimated.
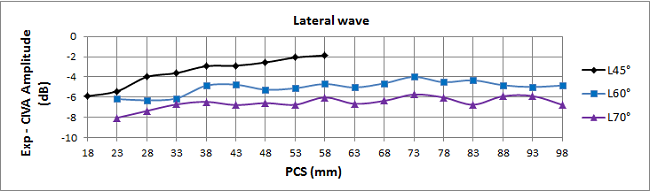
The origin of this overestimation of the amplitude of the lateral wave is still unexplained. It could be due to the fact that the modeling of the lateral wave uses a model which is valid when the point source S and the observation point M (i.e. receiver) are both in a single and same isotropic medium (Figure below). However, when performing a TOFD inspection with contact probes, this assumption is not verified because the two points, located in the wedges, are separated by air.
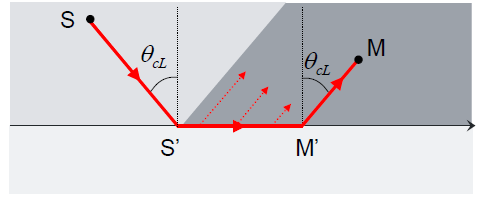
It is difficult to evaluate the errors in the prediction caused by this assumption. Moreover, they do not explain why the overestimation of simulated amplitudes decreases with the PCS for LW45° inspections. Thus, additional measures were carried out with immersion probes that meet the modeling assumption imposing the same environment for the source point and the observation point.
Ascans of the lateral wave
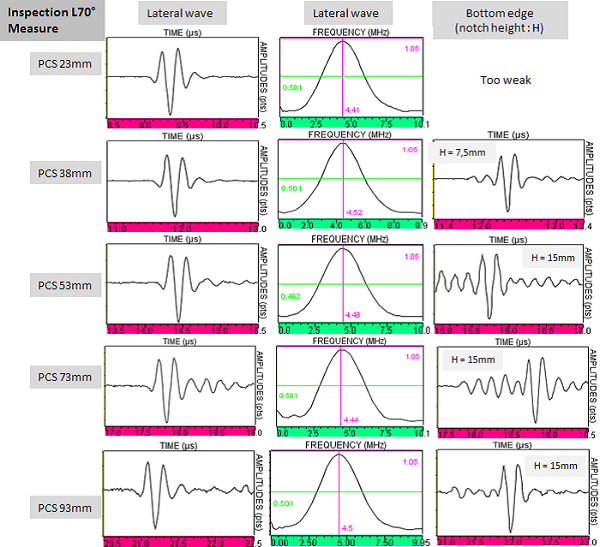
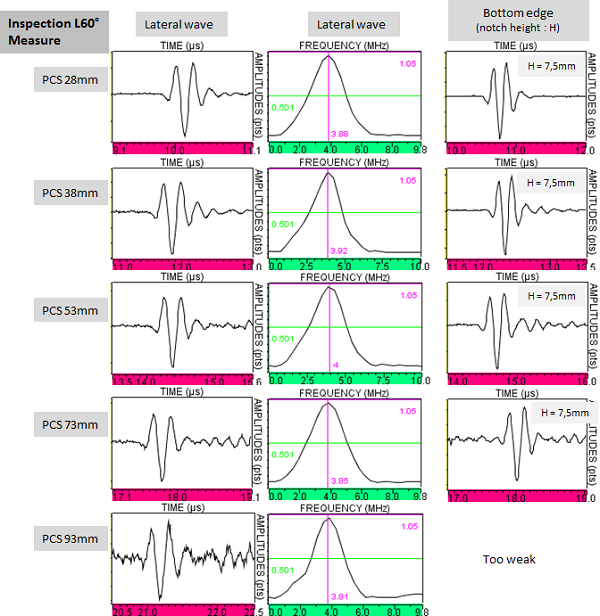
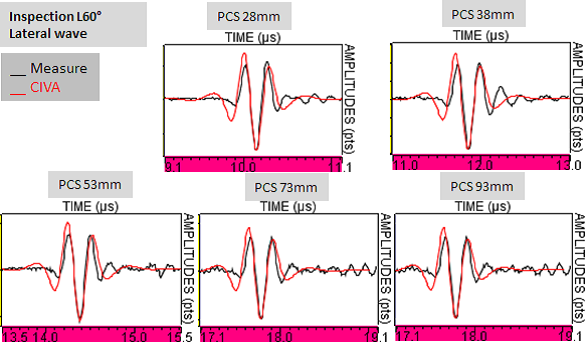
The experimental A-scans and F-scans of the lateral wave detected with LW70° and LW60° inspection are presented on the figure below. They show that :
- The wave form of the lateral wave does not vary a lot with the PCS
- The central frequency of its spectrum varies little with the PCS. For LW60° inspections, the central frequency is around 3.8 MHz and then lower than the central frequency of the entry signal (4.8 MHz). For LW70° inspections, the central frequency is 4.5 MHz and thus near to the one of the entry signal.
- The phase of the lateral wave and of the the bottom edge echo of a notch are the same.
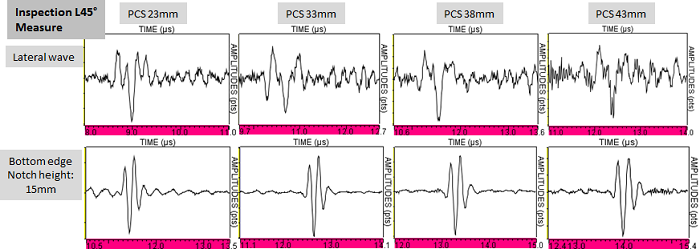
Regarding LW45° inspections, the incidence angle of the probes is far from the critical incidence. Thus, the lateral wave is very weak, its contribution is spread in time and there is no more relation between the phases of the lateral wave and those of bottom edge of the notch (see results below).
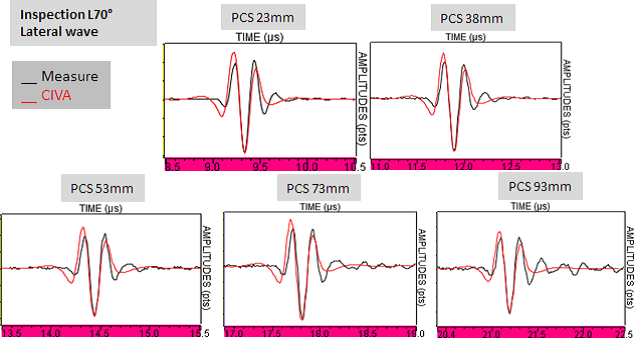
The two figures below show the comparison of the experimental and simulated Ascans of the lateral wave. When superposing these Ascans, a temporal offset has been applied. For a specific inspection (LW45°, LW60° or LW70°), this offset does not depend of the PCS. It corresponds to a positioning error of the center of each probe when it is fixed to its holder. The temporal offset is null for inspection in L70°. The superposition of the curves for LW60° configuration required the application of a temporal offset of 0.05 µs. For LW45° inspection, the offset is 0.51 µs. These offsets are lower than the measurement uncertainty of time of flight.
The shapes of the experimental and simulated A-scans for LW70 ° and LW60° inspections are close to each other. This is also true for LW45° inspections which are associated with complex waveforms relatively well predicted by CIVA.
Additional TOFD inspections in immersion
Because of the over estimation of the lateral wave amplitude with contact probes, additional measurements were performed in immersion in order to satisfy the modeling assumption on the medium of the source point and the observation point which should be the same. Experimental measurements were performed in immersion in a configuration allowing to gradually vary the incidence angle of the probe since it is a key parameter in the generation of the lateral wave.
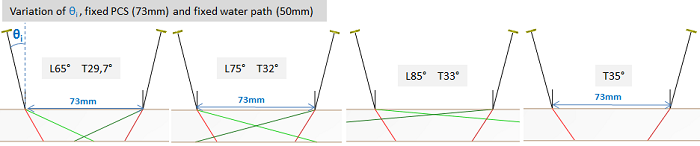
The immersion transducers that were used have 6.35mm diameter and 5MHz center frequency just like the contact probes used previously. During inspections, the PCS and the water path were kept constant: 73mm and 50mm respectively. Only the angle of incidence θi of the probes has been varied in order to generate in the specimen L waves from 60 ° to 85 ° and T-waves at 35 °.
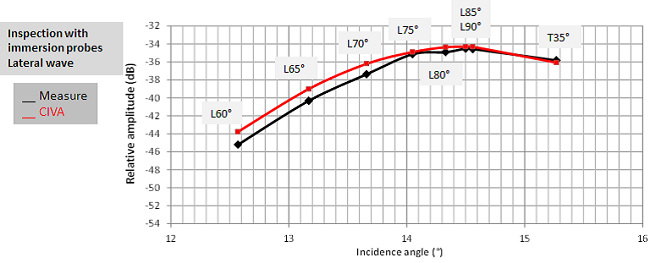
The amplitudes of the experimental and simulated lateral waves were compared (Figure below). The reference amplitude is the maximum amplitude of the L direct echo of a 2mm diameter SDH located at 5mm depth and detected with LW0° inspection in pulse-echo mode.
A very good agreement is obtained (difference less than 2dB) between experiment and simulation. CIVA predicts well the fact that the maximum amplitude of the lateral wave is obtained for the critical incidence angle for L waves. In immersion, there are no more the differences in amplitude measured between experimental and simulated results for LW70 ° and LW60 ° contact inspections (differences betwee 5 and 7 dB). This tends to confirm the idea that the differences observed in contact inspections are due to the non-compliance of the assumption on the single medium in the model that calculates the lateral wave. Further study of the model limits for contact probes should be done.
Conclusion
The study of the lateral wave detected with LW45°, LW60° and LW70° contact probes of 5MHz center frequency and 65% bandwidth showed that the amplitude of the lateral wave predicted by CIVA is overestimated 2 to 7 dB compared to the experiment.
The model used in CIVA to simulate the propagation of the lateral wave assumes that the point sources (on the surface of the transmitting probe) and observation points (on the surface of the receiving probe) are in a single and same environment. However, this is not the case in a TOFD inspection performed with contact transducers because of the wedges. Thus, the differences between experimental and simulated amplitudes of the lateral wave can be associated to the non-compliance with this hypothesis. To test this assumption, complementary experimental TOFD inspections were performed in immersion. The discrepancies between experiment and simulation are lower than 2dB. However, a detailed study of the limits of the model in the case of contact probes must be done before concluding with certainty that the origin of the differences obtained in contact configurations is related to non-compliance with the assumption of the model (i.e. the presence of the wedges).
Back to TOFD