
Multilayers – Case N°1
specimen
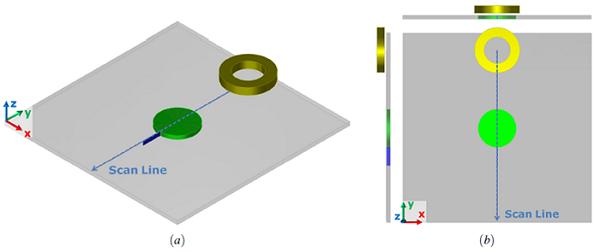
A plate in aluminium alloy, 2 mm thickness, is inspected with the coil described previously and scanning the specimen as in the figure below along y axis. The features of the piece material are also given below.
Monolayer in aluminium
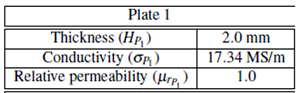
Specimen and its material features
Flaw
A flat bottom hole and a notch, both of same thickness as the plate, affect the latter. Figures below specify the features and the positionning of both flaws.
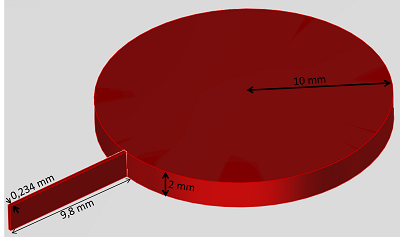
FBH and notch in the plate modeled in CIVA
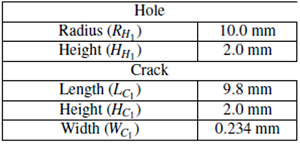
Features of both flaws present in the piece to inspect
EXPERIMENT/SIMULATION COMPARISONS
The experimental measurements have been realized with an impedancemeter, it has also not been necessary to calibrate the results before the comparison.
On figures below are superimposed experimental and CIVA curves. A good agreement is observed between experiment and simulation.
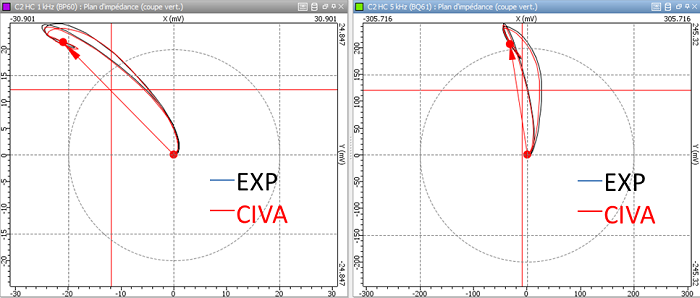
Lissajous curves in impedance plane, vertical cut, 1 kHz (left) et 5 kHz (right)
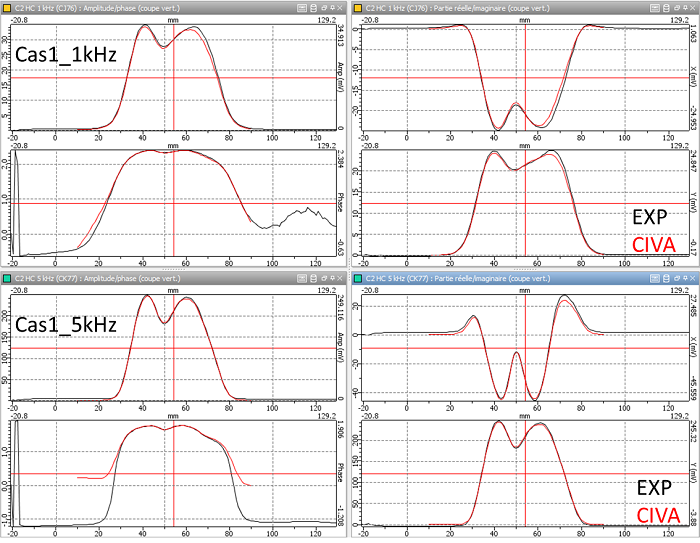
From top to bottom, then from left to right hand side : Amplitude, Phase, Real part, Imaginary part. Comparisons between experimental results (black curve) and simulation results from CIVA (red curve) for the case N°1 at 1kHz (top) et 5 kHz (bottom)
Finally, the table below gathers ampltudes and phases values and confirms the very low gap between experiment and simulation, less than 2 % in amplitude and 0.5° for the phase.
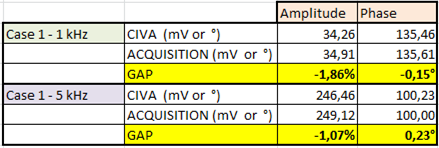
Maximal amplitudes values and corresponding phases, and discrepancies between CIVA and experiment (references: experimental values)
Continue to MULTILAYERS – CASE N°2
Go back to MULTILAYERS