
Shadowing – Analysis and interpretation of the results
Summary
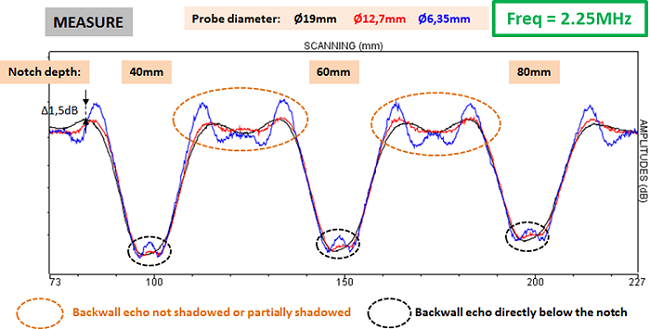
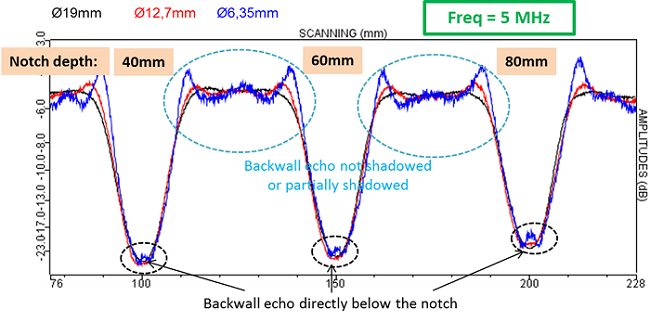
Superposition of experimental echodynamic curves of the backwall echoes measured with the 3 probes (Ø19mm, Ø12.7mm and Ø6.35mm) show that they are close to each other whatever the probe frequency (figures below). For the superposition, the amplitudes were normalized relatively to the non-shadowed backwall amplitude.
The figure below shows simulated (SPECULAR and KIRCHHOFF) backwall echoes for the 3 probes (Ø19mm, Ø 12.7mm and Ø 6.35mm) and for the 2 studied frequencies. For the superposition, the amplitudes were normalized relatively to the non-shadowed backwall amplitude. Then, the amplitudes cannot be compared.
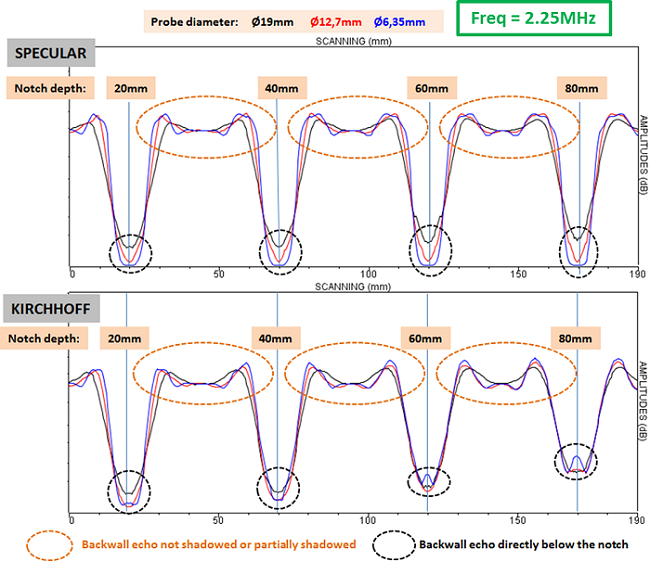
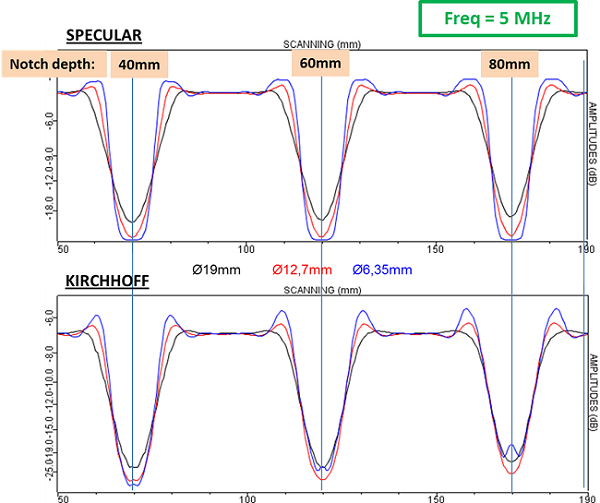
The comparison of previous echodynamic curves (simulated and experimental) highlights differences between experiment and simulation with the SPECULAR and KIRCHHOFF models. The results interpretation is presented below in the document.
The SPECULAR model limits
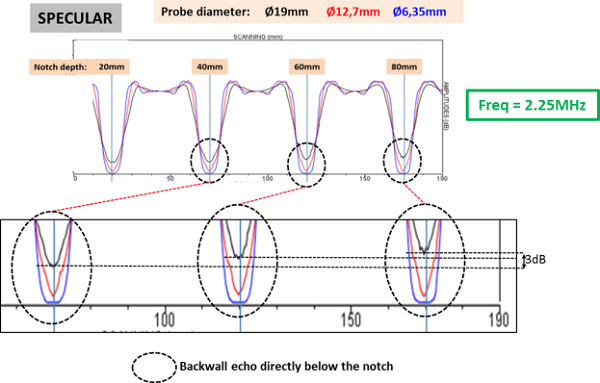
The figure below shows simulated backwall echoes with the specular model for the 3 probes apertures at 2.25 MHz. At the bottom of the figure, the zooms on the figures corresponding to the shadowed backwall echo zone show that the SPECULAR model predicts:
- For the Ø19mm probe (black curve): the backwall amplitude just above the defect increases when the shadowing defect depth decreases from 80mm to 40mm (3dB, see left of the figure below). In other terms, the deeper is the shadowing defect, the bigger is the amplitude of the backwall echo.
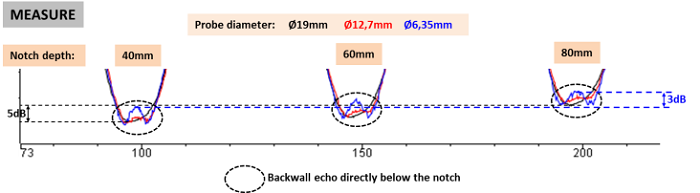
- For the Ø12.7mm and Ø6.35mm probes (red and blue curves): a null backwall echo (just above the defect) amplitude whatever the defect depth. This is not observed experimentally (figure on the right).
The SPECULAR model results are interpreted below:
Ø6.35mm probe:
The total shadowing just above the defect (whatever its depth) can be explained by the ray tracing of the following figure:
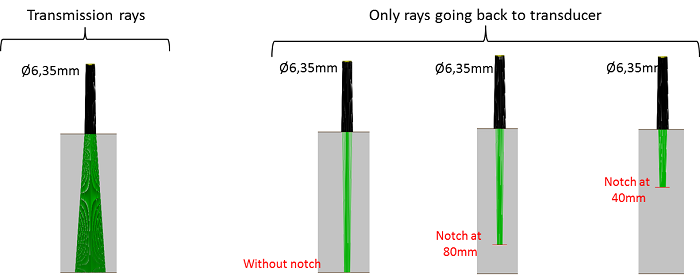
- The left part of the figure presents rays emitted by the probe in the specimen (for an arbitrary divergence of the beam)
- The right part of the figure shows the rays reaching the defect and/or the backwall and coming back to the probe after specular reflection.
This figure shows that in presence of a flaw (2 cases on the right side of the figure), whatever its depth, no rays reaching the backwall come back to the probe when the aperture is 6.35mm (less than the defect width). This results on a backwall echo of null amplitude. The only specular rays that come back to the probe are the one reflecting the flaw.
Ø19mm probe:
The probe aperture is larger than the defect width and the SPECULAR model predicts a backwall echo which amplitude depends on the depth of the shadowing defect. The deeper is the shadowing defect, the more important is the amplitude of the backwall echo. It can be explained by the ray tracing on the figure below:
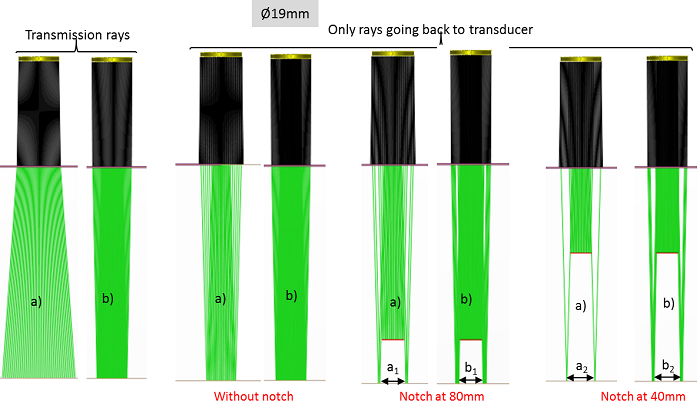
- The left side of the figure presents rays emitted by the probe in the specimen. Two cases were considered: “case a” for divergent rays in the specimen and “case b” for convergent rays in the specimen (see figure above).
- The right part of the figure represents for case a and b only the rays reaching the defect and/or the backwall and coming back to the probe after a specular reflection.
It can be noted that for defects at 40mm and 80mm depth, some specular rays come back to the transducer. This leads to non-null backwall echo amplitude. The ray tracing highlights a number of rays coming back to the probe after backwall reflection more important when the shadowing defect is deep. The shadowed zone width is larger for the 40mm deep defect than for the 80mm deep ribbon (see a2 and b2 on the figure above).
The explanations for the 2.25 MHz probes are valid for the 5MHz probes. The SPECULAR model is not adapted for transducers with aperture narrower than the width of the shadowing defect. It predicts total shadowing just above the ribbon. Indeed, this model takes only into account the contribution of rays reaching the backwall and coming back to the probe after a specular reflection.
Comparison of CIVA and CIVA-ATHENA2D simulations of the beam in the specimen
The interpretations of the actual section concern only results obtained with the KIRCHHOFF model.
The figure below presents the result of a CIVA-ATHENA2D simulation performed with the Ø6.35mm probe in a zone containing the shadowing defect located at 80mm depth and the backwall. This case corresponds to the one where an overestimation of the amplitude just above the defect is noted.
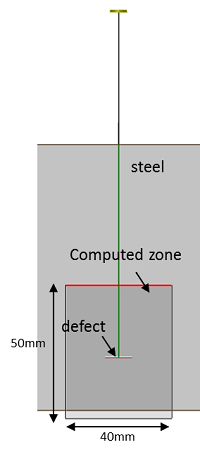
The different cartographies show the beam in the specimen at different times and allow to see:
- The beam diffracted by the defects boundaries (noted DB) which appears under the defect “continuously” with the incident front beam IB (c).
- A constructive interference of the incident and diffracted beam by the defect edges just above the defect (d). The reflected wave front by the backwall RBB corresponds to a combination of the reflection on the backwall of the 2 fronts diffracted by the edges of the defect and the incident front either side of the flaw.
- The beam coming back from the specimen backwall and diffracted by the defect boundaries and radiant above the defect DB2, which is continuous with the front coming back from the specimen RBB and passing through each side of the defect (g).
These images show the beam complexity in the shadowed part of the incident beam located under the defect (figures b to d) and in the shadowed zone of the reflected beam on the specimen backwall located above the defect (figures e to j). It can be seen just above the defect center that the incident beam on the front presents an artefact (image d). This corresponds to the crossing point of the 2 diffracted fronts.
Just above each edge, interferences between the direct incident front and the diffracted front by the corresponding edge can be visualized. These interferences have an effect on the beam amplitude on the front and curve the wave front when it is close to the edge. Presumably, the previous effects from direct interference transmission / diffraction edges of the ribbon explain the increased amplitude observed experimentally directly above the center of the ribbon.
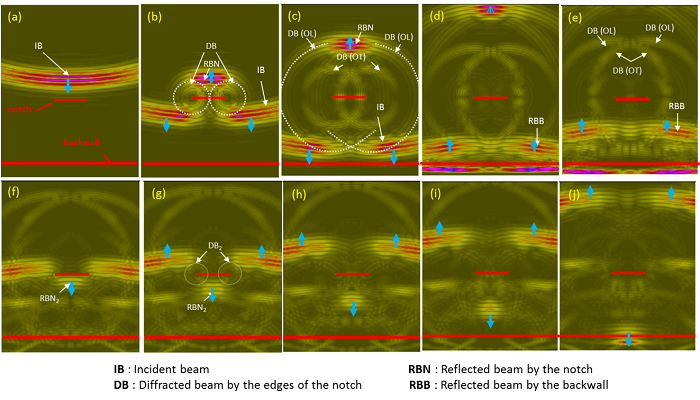
The cartographies of the beam calculated with CIVA in the same configuration are presented on the figure below (the defect is simulated with a thin volume full of air). The incident beam diffracted by the defect and the beam reflected by the backwall and diffracted by the flaw is not taken into account during CIVA beam calculation. Then, we obtain total shadowed zones and sharp breaks in the beam that are not realistic.
KIRCHHOFF artefact
The KIRCHHOFF model predicts, like experiments, amplitude elevation of the backwall echo when the probe is located just above the flaw. This increase is more important as the flaw is deeper. It is an artefact due to the sharp break in the incident beam at the backwall depth (see previous figure).
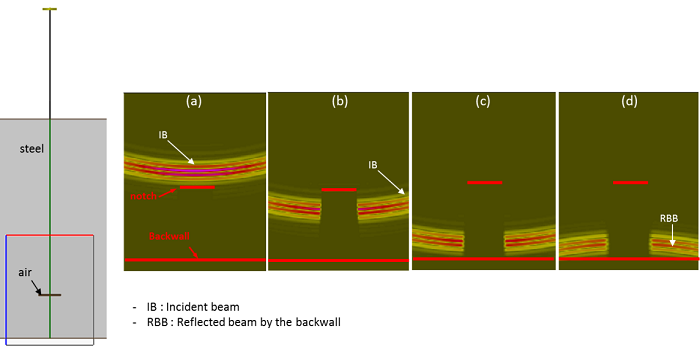
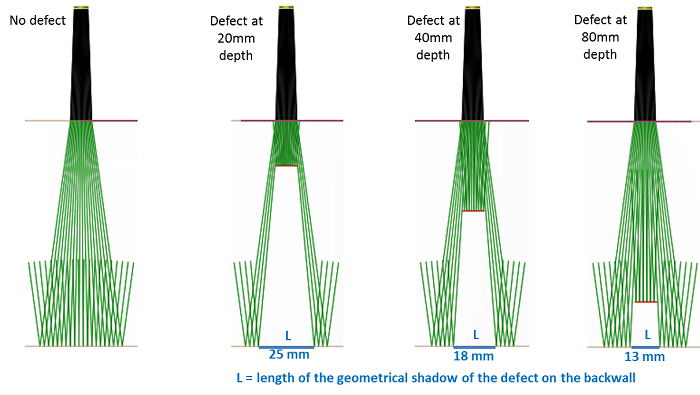
In order to illustrate the creation of this artefact, the echo from a backwall with a hole as large as the zone shadowed by the defect has been simulated. The zone dimension depends on the defect depth as it can be seen with the ray tracing on the figure below. For the ribbons located at 20mm, 40mm and 80mm depth, the width of the shadowed backwall corresponds to 25mm, 18mm and 13mm respectively.
For the ribbons located at 20mm, 40mm, and 80mm depth, the shadowed backwall width is 25mm, 18mm, and 13mm respectively for the Ø6.35mm probe.
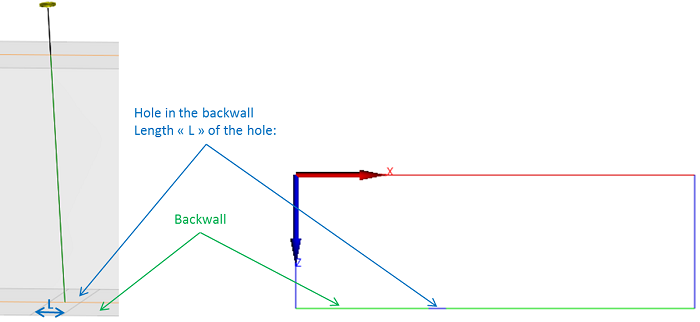
The figure below presents the configuration used to simulate the echo from a backwall presenting a hole. The aperture of the backwall corresponds to the blue part on the backwall side defined in green in the specimen CAD:
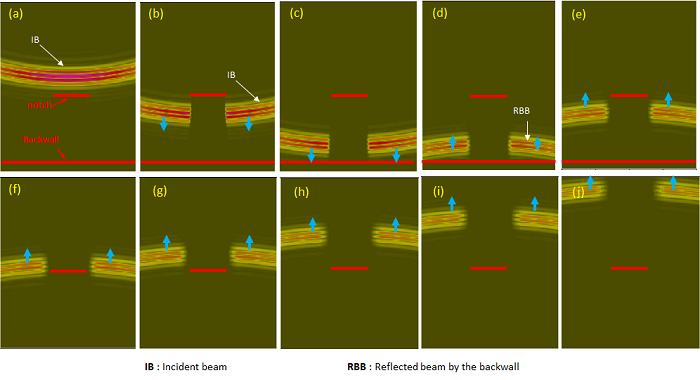
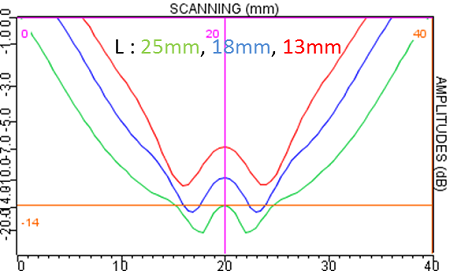
The echodynamic curves of the specimen backwall echo calculated with the KIRCHHOFF model in the 3 configurations corresponding to the shadowing from ribbons located at 20mm, 40mm and 80mm depth are presented on the following figure. They show an increase of the backwall echo amplitude when the probe is located just above the aperture in the backwall. They show also lower shadowing for biggest ribbons depths. This amplitude elevation, due to the sharp break « backwall-aperture-backwall » is an artefact and does not correspond to a physical phenomenon which is in reality associated with the interference between the direct beam and the beam diffracted by the defect edges. It has to be noted that the KIRCHHOFF model doesn’t allow modeling the LdLrbLdL mode involving 2 diffractions on the defect. It is not the case for ATHENA which highlights that the beam reflected by the backwall (RBB) corresponds to a combination of the reflection on the backwall of the 2 diffracted fronts by the edges of the defect and by the incident front and a first diffraction on the flaw.
Continue to Conclusion
Back to Shadowing