
Shadowing – Results with the Ø12.7mm single element probe
Summary
Results at 2.25 MHz
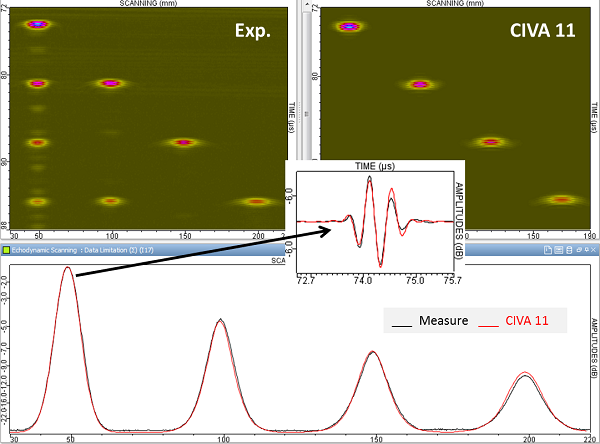
The figure below shows a comparison of echodynamic curves shape from simulated and experimental specular echoes for all the ribbons. The curves superimposition shows a good agreement in terms of amplitude and echoes spreading. There is only up to 0.5 dB difference (the reference is the SDH).
A comparison of experimental and simulated echodynamic curves with the KIRCHHOFF and the SPECULAR models for backwall echoes calculations is presented below.
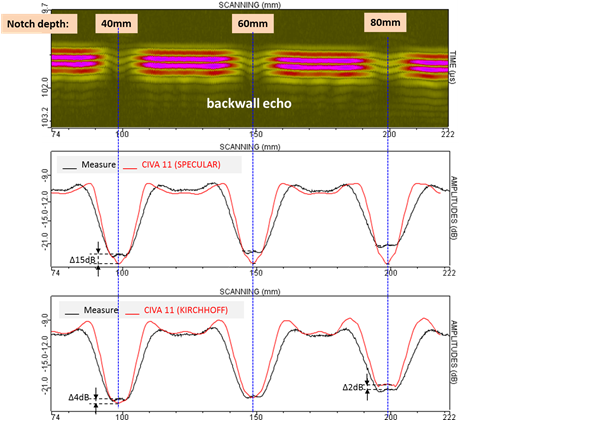
Regarding the non-shadowed part of the backwall echo: The non-shadowed backwall echo is well predicted by both CIVA models. The differences are less than 1 dB.
On the transition zone between the shadowed backwall and the non-shadowed backwall, there is a good agreement between experimental and simulated echodynamic curves whatever the model used for simulation.
Regarding the shadowed part of the backwall echo, both models for backwall echo calculation provide different results:
- The SPECULAR model provide results different from experiment since it predicts an almost total shadowing just above the defect
- For the ribbons at 60mm and 80mm depth, the KIRCHHOFF model is in good agreement with experiment. The maximum amplitude difference (4dB) is measured for the defect at 40mm depth. It should be noted that the experimental echodynamic curve presents a slight increase in amplitude just above the defect. This phenomenon is well reproduced by the KIRCHHOFF model only for the defect at 80mm depth. It will be discussed and interpreted later in the document.
The curve below presents the evolution of the shadowed backwall ribbons direct echoes amplitude.
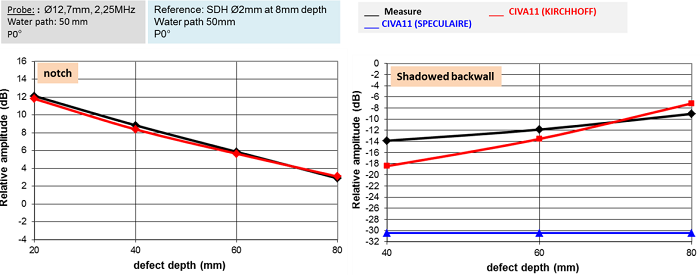
The error in the prediction is lower than 1 dB. However, the shadowed backwall amplitude evolution is not well predicted by the KIRCHHOFF model which underestimates (-4dB) the backwall echo under the less deep ribbon and overestimates (+2dB) the backwall echo under the deepest ribbon. The SPECULAR model predicts an almost total shadowing effect and then is far from the experiment.
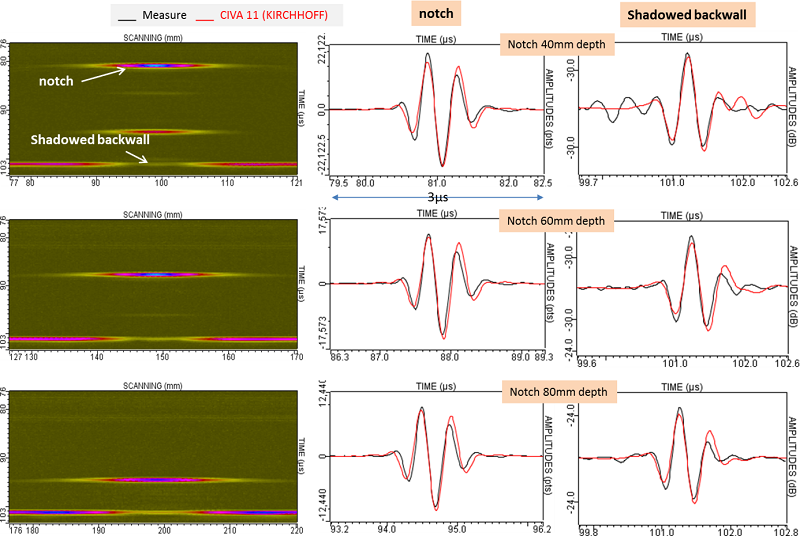
The superposition of simulated and experimental Ascans (the backwall echo is calculated with the KIRCHHOFF model) of ribbons echoes and the shadowed backwall is presented on the figure below. Ascans were extracted just above each ribbon. Their shapes are in good agreement even where amplitude differences were noted on echodynamic curves.
Results at 5MHz
The figure below shows a comparison between experimental and simulated direct echoes from ribbons. The simulated results are presented with and without attenuation taken into account.
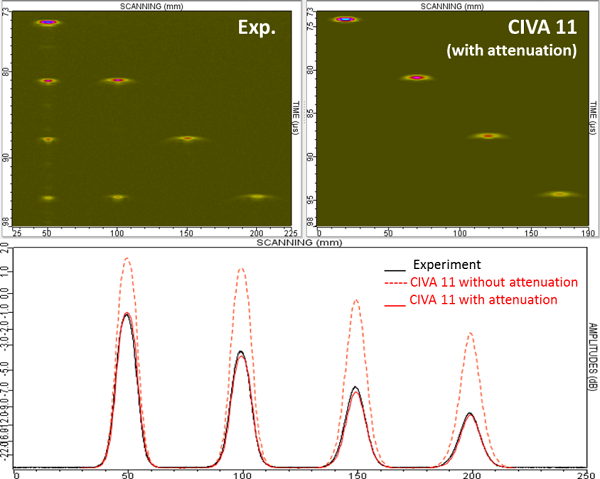
The echodynamic curves superimposition shows important differences between experiment and simulation when the attenuation is not taken into account in CIVA. However, when attenuation is used, there is a very good agreement on amplitude and echodynamic shaped of simulated and experimental results.
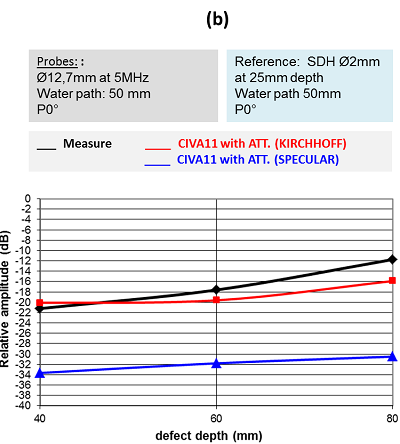
The amplitude evolution is presented on the figure below.
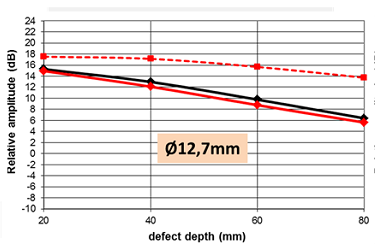
When attenuation is not taken into account in CIVA, the difference between experimental and simulated amplitudes may reach 8dB on the echo of the ribbon located at 80mm depth.
The comparison results show that the attenuation is correctly set since the differences between experiment and simulation are in general less than 1dB.
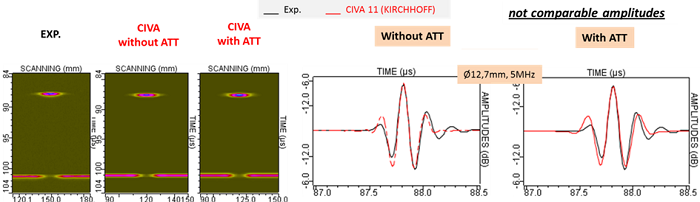
The figure below shows the superposition of experimental and simulated Ascans (with and without attenuation taken into account) for the ribbon at 60mm depth. Their shapes are in good agreement.
A comparison of the simulated (KIRCHHOFF + SPECULAR models) and experimental echodynamic curves of the shadowed (or not) backwall echo is presented below for the Ø12.7mm probe. The evolution of the shadowed backwall echo just above the defect is also shown.
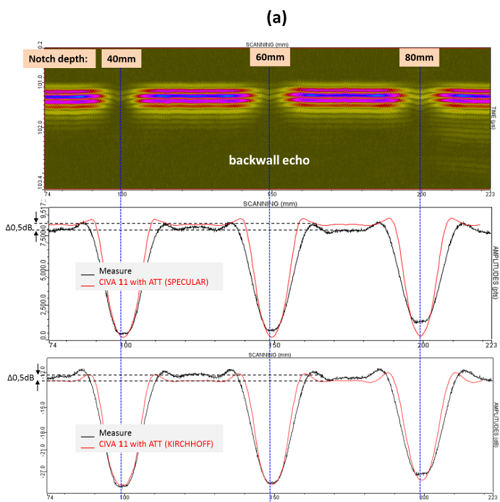
When the backwall echo is not shadowed:
The non-shadowed backwall echo is well predicted by both calculation models of CIVA. The differences are around 0.5dB. As for the Ø19mm probe, it is due to an overestimation for the SPECULAR model and an underestimation for the KIRCHHOFF model.
When the backwall echo is shadowed:
As for the results at 2.25 MHz, for this probe which has an aperture close to the ribbons width, the results at 5MHz with the SPECULAR model are not in good agreement with experiment.
Regarding the KIRCHHOFF model, the tendencies are well reproduced. The shadowing effect is stronger as the defect is deeper. The amplitude differences are between 2 to 4 dB between experiment and simulation.
Continue to Results with the Ø6.35mm single element probe
Back to Shadowing