In the frame of the experimental characterization studies, SDH have been first considered as their amplitudes are used for the inspection calibration. Then, surface and backwall breaking notches have been investigated. Studies are still in progress, especially to analyze lateral wave echo.
Some cases present discrepancies between experimental and numerical results. Explanations of those differences are given in the next section.
Side drilled holes response
After some generalities to describe the studied configuration, the experimental and simulated SDH defect responses obtained with different probes will be presented in this section:
| Nominal frequency | Real frequency | Crystal | Mode | Nominal refraction angle | Real refraction angle |
| 5 MHz | 4.85 MHz | Ø6.35 mm | P60 | 60° | 59° |
| P45 | 45° | 44.5° |
Configuration
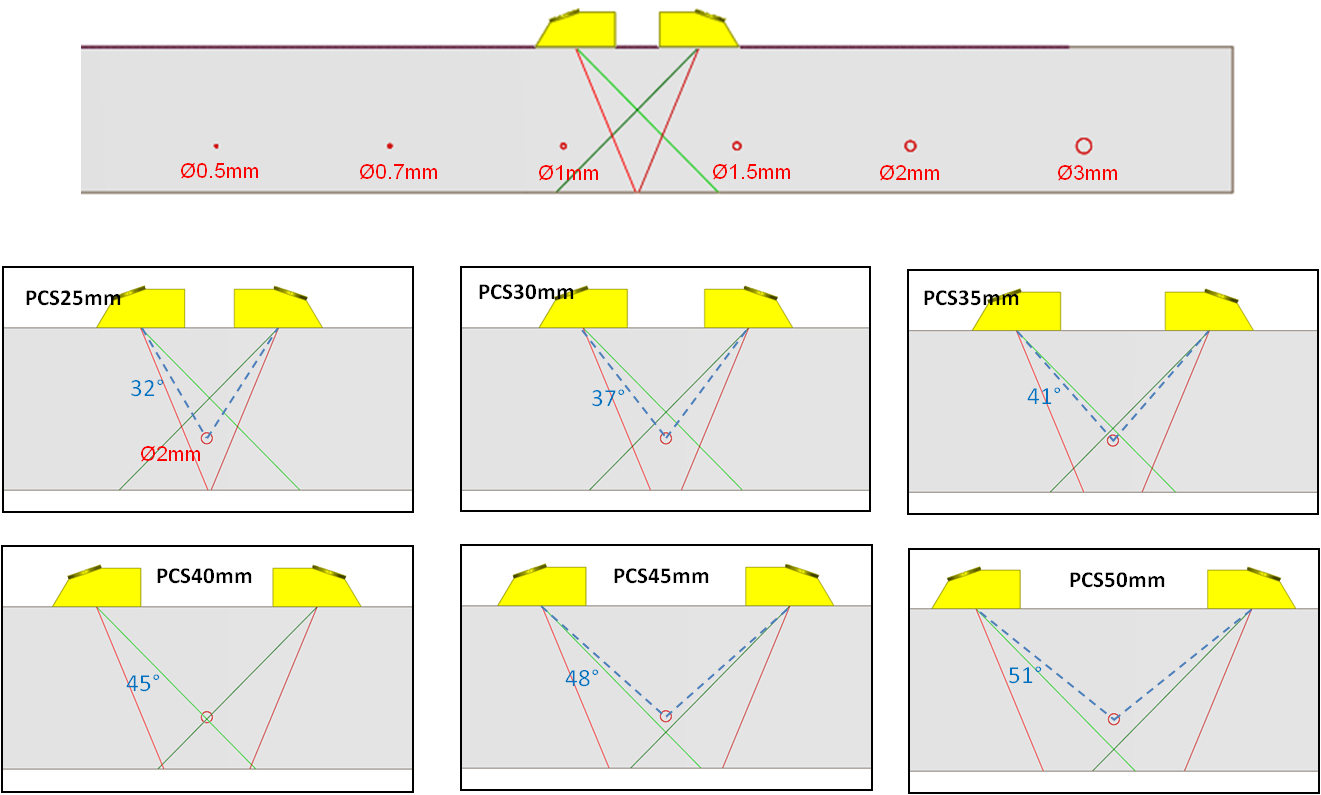
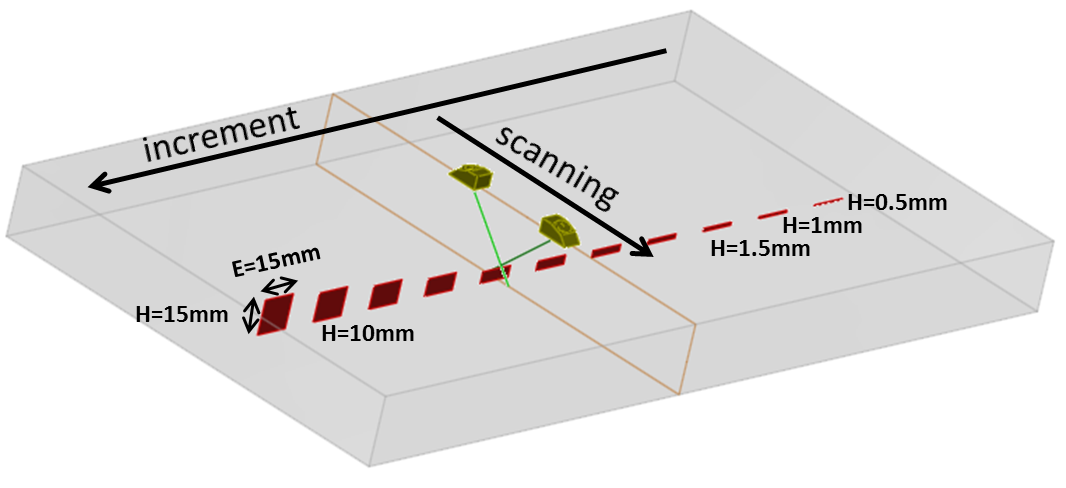
The specimen tested in this part is a plane-parallel specimen of 30 mm width. It contains 6 SDH with different diameters. An illustration is shown hereafter:
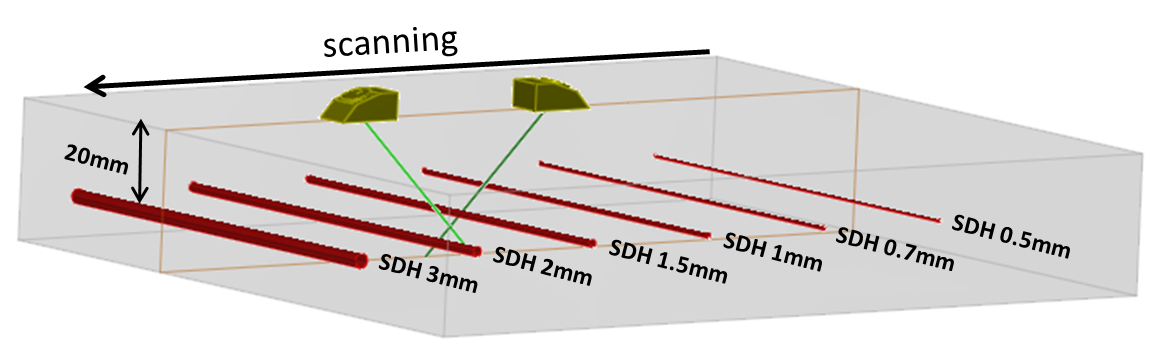
All SDH are located at 20 mm depth, SDH diameters are Ø0.5, Ø0.7, Ø1, Ø1.5, Ø2 and Ø3 mm.
TOFD inspection is performed on this specimen varying the PCS from 40 mm to 80 mm.
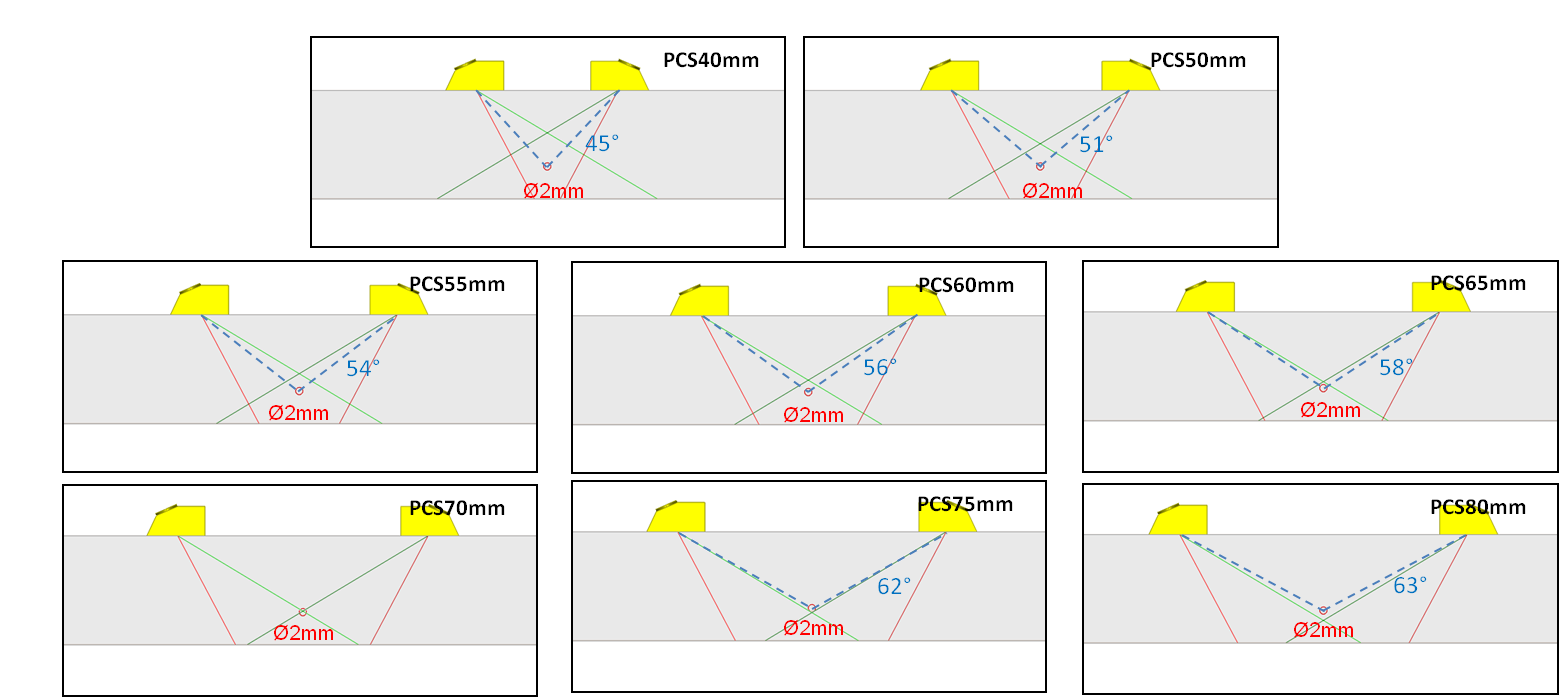
When the PCS increases, P theoretical axes of both transducers intersect first above, then below the different diameters SDH located at 20 mm depth. The crossing point is at the same depth of the SDH when the PCS is around 70 mm. Those axes, as well as the incident angles on the SDH, are represented on the following figure:
SDH echoes examples obtained for different PCS
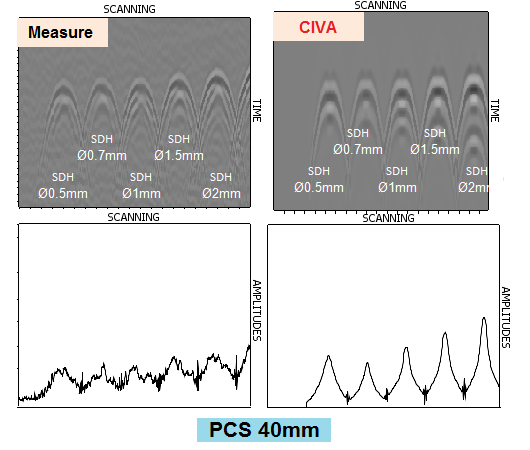
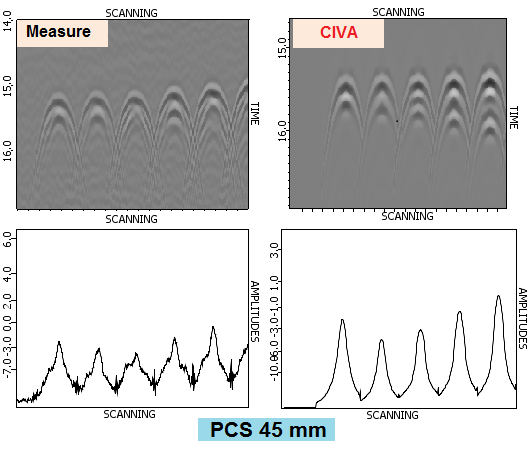
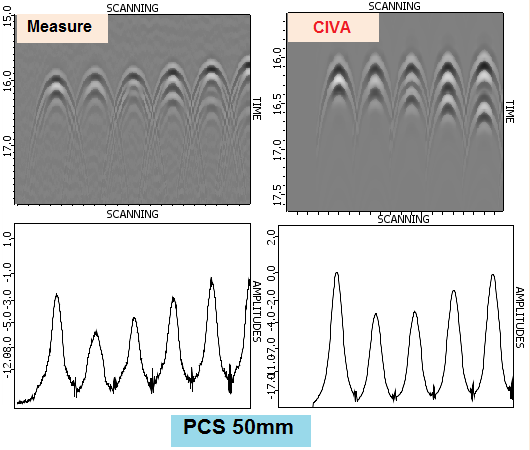
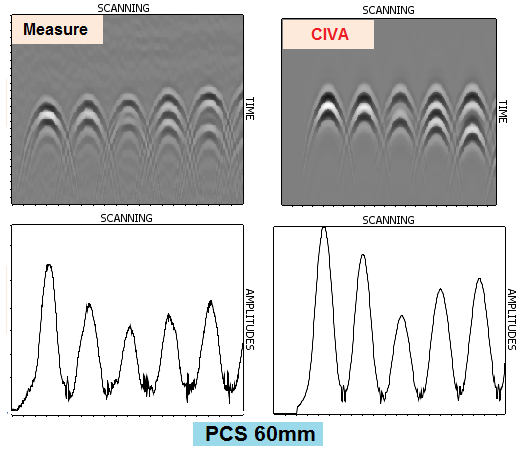
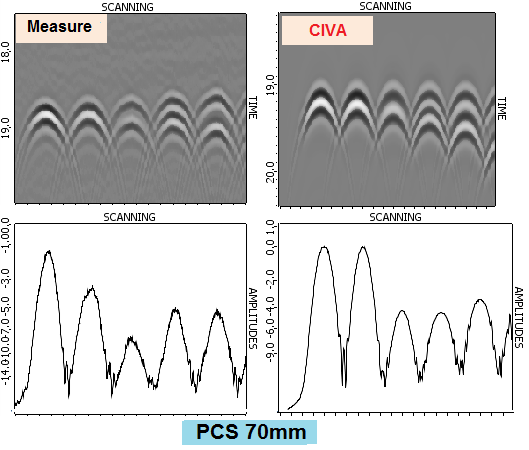
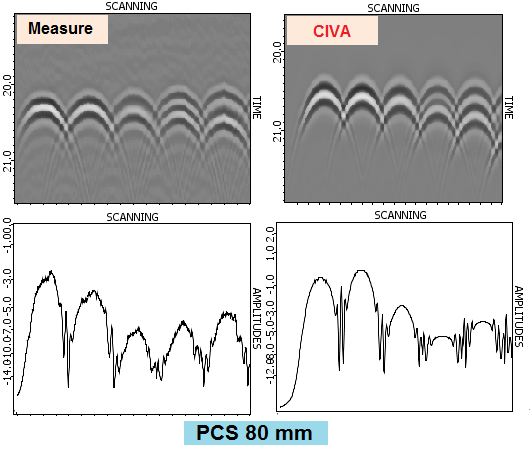
The following Ascans correspond to different PCS in the case of an inspection executed with the P60 transducer at 5 MHz:
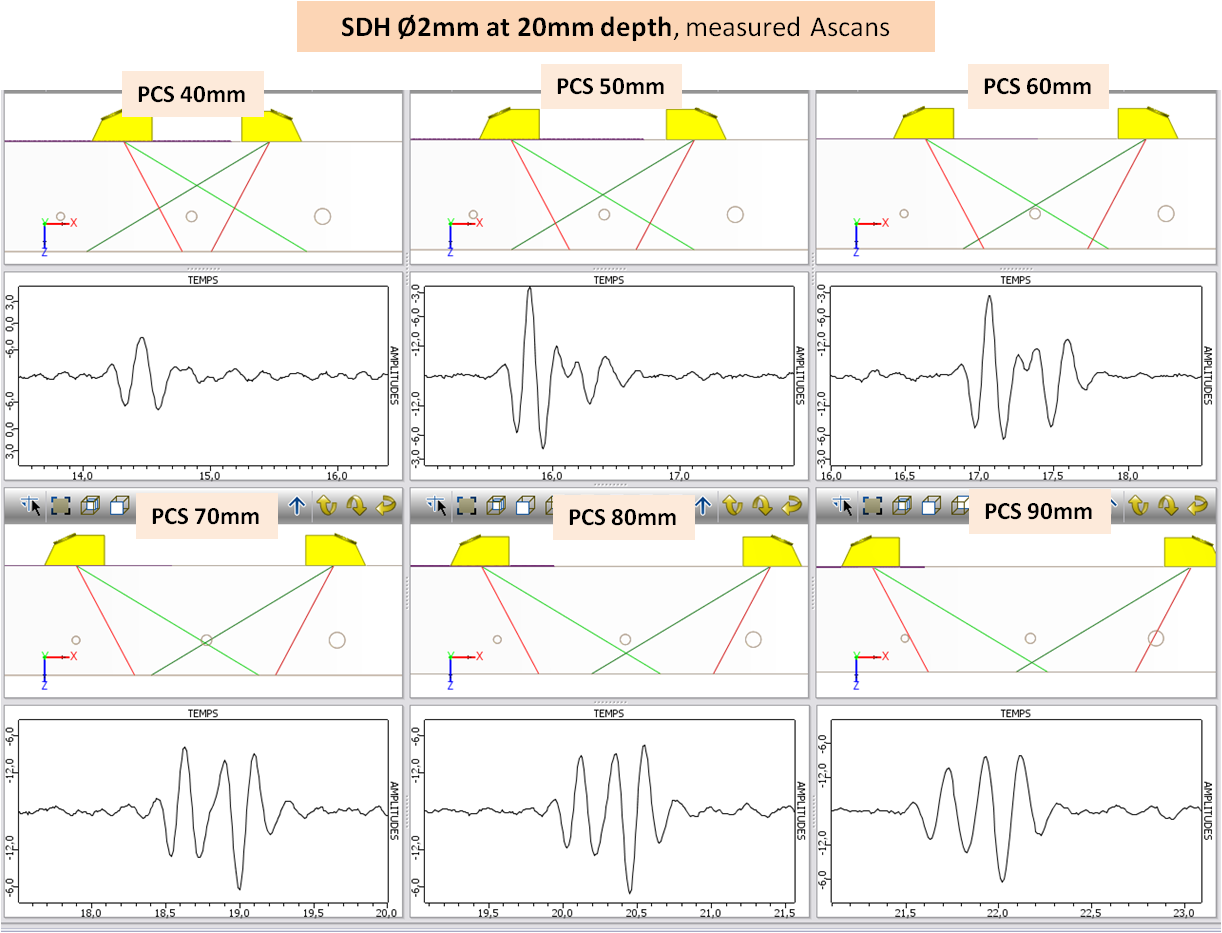
According to those results, we observe two temporally slightly shifted contributions, one corresponding to the specular reflection on the SDH, the other to the creeping wave propagating along the SDH circumference. Following phenomena are noted for this configuration.
- When the P axes crossing point is on the SDH, those both contributions are clearly distinct. Their amplitudes are similar and their phases are in opposition.
- When the P axes crossing point is above the SDH, the first contribution is bigger. The second echo amplitude first decreases (50 mm and 60 mm PCS cases), then only one echo becomes distinguishable (40 mm PCS case).
- When the P axes crossing point is below the SDH, the second contribution becomes bigger. The first echo amplitudes decreases then only one echo, spread out over the time, becomes distinguishable (80 mm and 90 mm PCS cases).
The fact that the creeping wave amplitude increases relatively to the specular wave amplitude when the PCS increases could be explained by its way around the side drilled hole which is shorter for great PCS than for the little corresponding to a weaker energy loss by irradiation along this way (cf. figure below).
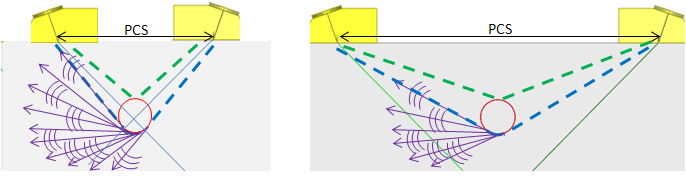
Moreover, the specular echo amplitude decreases when the “apparent” incident angle increases (with the PCS rise).
SDH results on P60 mode
For different PCS, incident angles on SDH center located at 20 mm depth versus PCS are listed in the following table. This incident angle is bigger than 60° for a PCS larger than 70 mm.
| PCS (mm) | 40 | 45 | 50 | 55 | 60 | 65 | 70 | 75 | 80 |
| Incidence angle (°) | 45 | 48 | 51 | 54 | 56 | 58 | 60 | 62 | 62 |
When the PCS increases, theoretical P axes of both probes intersect first above, then below SDH from different diameters located at 20 mm depth. The crossing point is at the same depth as the SDH when the PCS is around 70 mm (see figure below).
amplitude comparison for the P60 probe
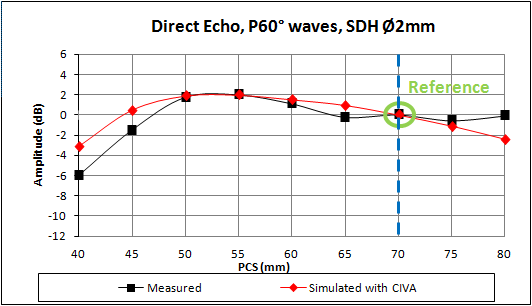
Maximal amplitude evolution of SDH echoes from 0.5 mm to 2 mm diameter located at 20 mm depth is presented versus the PCS. Experimental results are compared to simulations performed with CIVA 10.
The calibration reference in amplitude corresponds to the Ø2 mm SDH echo located at 20 mm depth obtained during the inspection with the 70 mm PCS. The doted blue line points out the PCS for which the P axes crossing point depth is 20 mm (SDH depth).
 ;
; 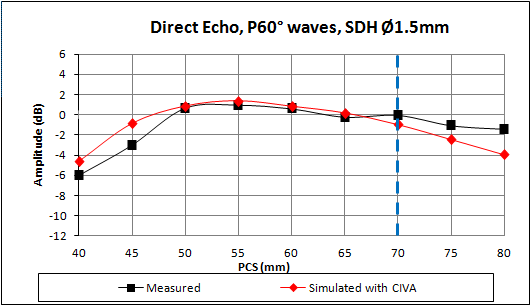
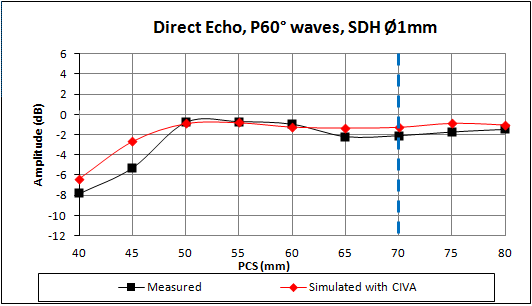
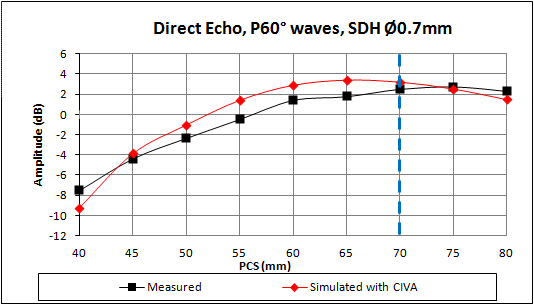
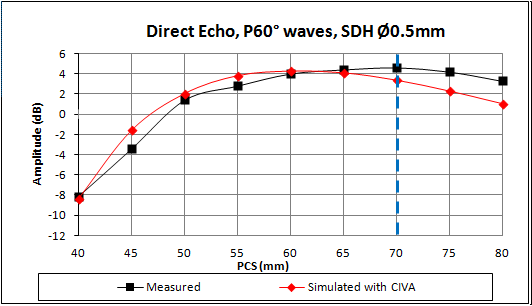
The SDH amplitude variation as a function of PCS is well predicted by CIVA. A good agreement is obtained between simulation and experiment for each SDH diameter. The maximum difference between experimental and simulated results is 2.8 dB. The table below reports the differences between experiment and simulation. These results show that the biggest differences appear for the smallest (45 mm) and the largest (80 mm) PCS.
| Experiment / Simulation discrepancies (dB) | PCS (mm) | |||||||||
| 40 | 45 | 50 | 55 | 60 | 65 | 70 | 75 | 80 | ||
| SDH diameter (mm) | 2 | 2.8 | 2.0 | 0.2 | 0.0 | 0.4 | 1.2 | 0.0 | -0.5 | -2.3 |
| 1.5 | 1.4 | 2.1 | 0.2 | 0.4 | 0.2 | 0.4 | -0.9 | -1.4 | -2.5 | |
| 1 | 1.4 | 2.6 | -0.1 | -0.1 | 0.3 | 0.9 | 0.8 | 0.9 | 0.5 | |
| 0.7 | -1.7 | 0.5 | 1.3 | 1.9 | 1.5 | 1.7 | 0.7 | -0.2 | -0.8 | |
| 0.5 | -0.2 | 1.8 | 0.7 | 1.0 | 0.3 | -0.3 | -1.2 | -1.9 | -2.2 | |
B-scans and echodynamic curves with the P60 probe
Experimental echodynamic curves obtained for PCS of 40 mm and 45 mm are very noisy (experimental results for the PCS of 40 mm were not used for comparison between experimental and simulated amplitudes).
The more the PCS increases, the more echodynamic curves are spread around the maximum amplitude (corresponding to a scanning probe position for which the beams crossing point lies vertically in alignment with the SDH). This spreading is bound to the beam’s one because of the distance between the transducer and the SDH which increases with the PCS. The figures below show the comparison between simulated and experimental measures for different PCS.
 ;
; 
 ;
;
A-sacns comparison for the P60 probe
The superimpositions of experimental and simulated Ascans of SDH whose diameters spread out from 0.5 to 2 mm with a 70 mm PCS (theoretical rays intersection) are presented hereafter. A time shift around 0.4 µs is applied before the experimental and numerical Ascans superposition. This time shift is negligible because its value is close to the measurement uncertainties.
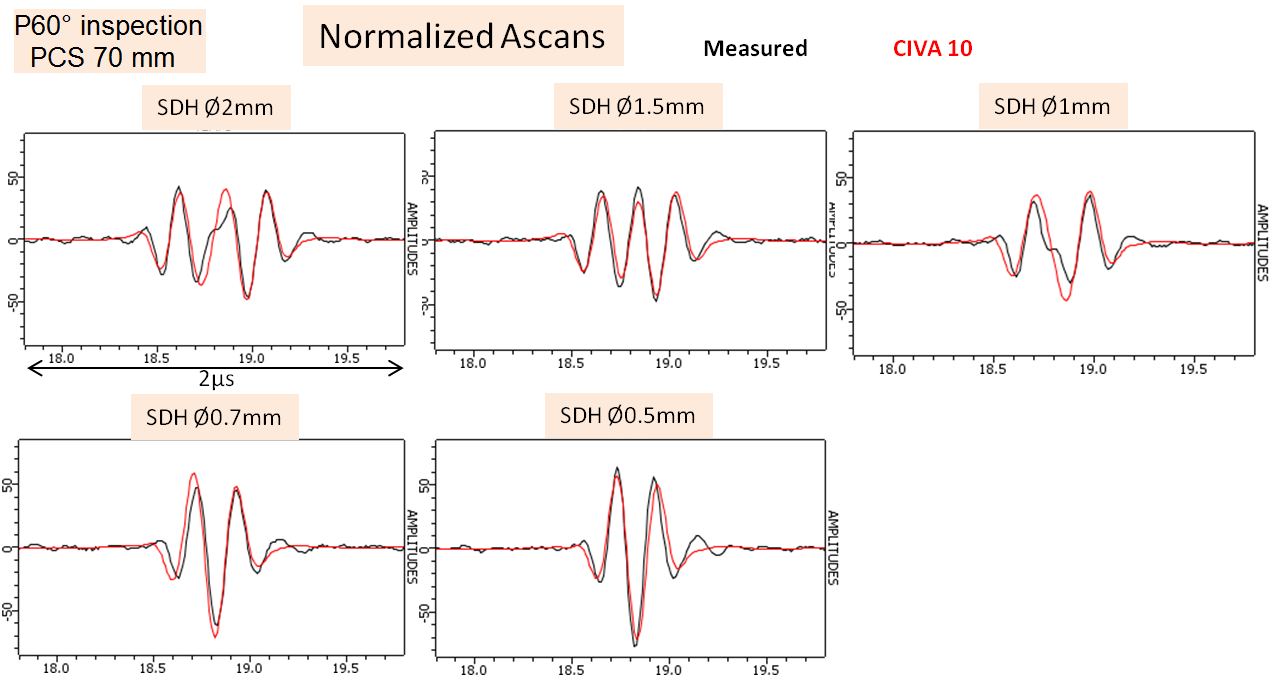
As seen previously, when the SDH diameter increases, the SDH response is splitting into 2 distinct contributions. This phenomenon is predicted by CIVA as well for the global signal shape than for both echoes relative amplitudes.
The superposition of the measured and simulated with CIVA10 Ascans of the Ø2 mm SDH located at 20 mm depth are also represented for various PCS. A time shift is applied before the measured and simulated Ascans superposition of around 0.25 µs for the 50 mm diameter PCS and of around 0.4 µs for the other PCS. Once again, this time shift is acceptable because its value is close to the measurement uncertainties.
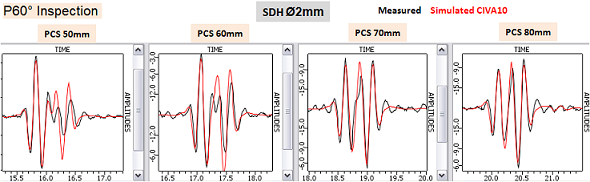
As previously, CIVA predicts the presence of 2 echoes generated by the SDH but their relative amplitudes are not always correct: in the case of the 50 mm and 60 mm PCS (P axes crossing point above the SDH) the second echo is overestimated by CIVA. When the crossing point depth is the same as the SDH depth, the amplitudes of the 2 echoes (which are similar) are well predicted.
The amplitudes obtained with CIVA10 for those Ø2 mm SDH echoes versus the PCS are in good agreement with those measured, even if the second echo amplitude is not correct, because its amplitude, weaker as the first echo amplitude, does not affect the maximal amplitude measure of the SDH echo.
SDH ReSULTS on P45 MODE
For all different PCS, incidence angles on the center of a SDH at 20 mm depth versus the PCS are listed in the following table. This incidence angle is bigger than 45° for a PCS larger than 40 mm.
| PCS (mm) | 25 | 30 | 35 | 40 | 45 | 50 |
| Incidence angle (°) | 32 | 37 | 41 | 45 | 48 | 51 |
Both probes' theoretical P axes intersect on the different diameters SDH located at 20 mm depth when the PCS is around 40 mm. The figure hereafter illustrates those axes.
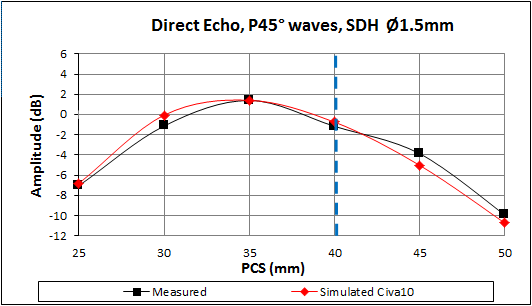
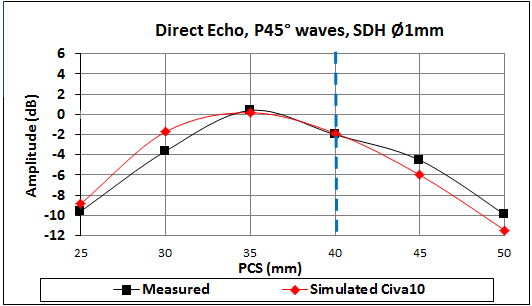
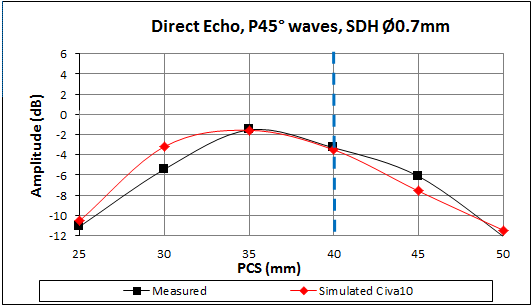
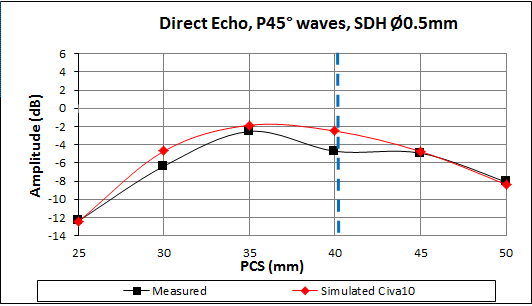
amplitudes comparison for the P45 probe
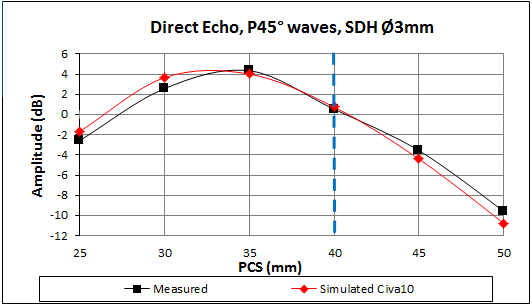
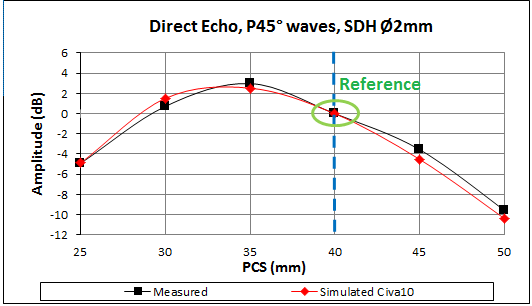
The maximum amplitudes evolution of the echoes of the SDH from 0.5 mm to 3 mm diameter located at 20 mm depth is presented as a function of the PCS. The experimental results are compared to simulations carried out width CIVA 10.
The amplitude calibration reference corresponds to the Ø2 mm SDH echo located at 20 mm depth obtained for the inspection width the 40 mm PCS. The doted blue line indicates the PCS for which the P axes crossing point depth is 20 mm (SDH depth).
 ;
; 
 ;
;
The table below synthetizes the discrepancies obtained between simulations and measures.
| Experiment /simulation discrepancies (dB) | PCS (mm) | ||||||
| 25 | 30 | 35 | 40 | 45 | 50 | ||
| SDH Diameter (mm) | 0.9 | 1.1 | -0.3 | 0.2 | -0.8 | -1.2 | |
| 2 | 0.0 | 0.8 | -0.5 | 0.0 | -1.0 | -0.8 | |
| 1.5 | 0.2 | 1.1 | 0.0 | 0.4 | -1.1 | -0.8 | |
| 1 | 0.7 | 1.9 | -0.2 | 0.1 | -1.5 | -1.5 | |
| 0.7 | 0.6 | 2.2 | 0.0 | -0.2 | -1.5 | 0.6 | |
| 0.5 | -0.1 | 1.7 | 0.7 | 2.2 | 0.2 | -0.3 | |
The amplitude evolution of different diameters SDH echo versus the PCS is well predicted by CIVA. A very good agreement is obtained between simulation and experiment for the whole SDH diameters. The maximum discrepancies between simulation and experiment reach 2.2 dB. For all SDH diameters, the experimental and simulated echo, which amplitude is the maximal, is obtained for the 35 mm PCS which corresponds to the P axes crossing point located above SDH top.
A-scans comparison for the P45 probe
The superposition of experimental and simulated Ascans of 0.5 to 3 mm diameter SDH width a 40 mm diameter (theoretical rays intersection) is presented hereafter. An about 0.2 µs time shift is applied for the measured and simulated Ascans superposition. This time shift is weaker than the measure uncertainties.
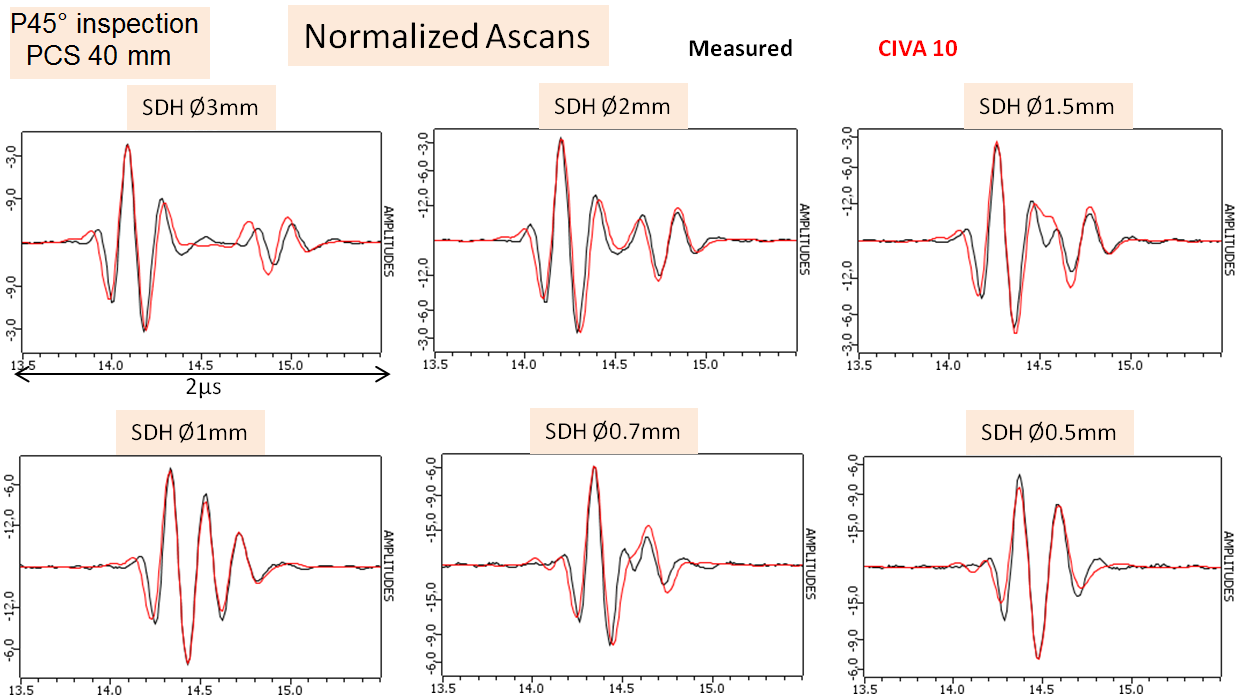
As seen previously, when the SDH diameter increases, the SDH response splits into 2 distinct contributions. This phenomenon is well predicted by CIVA for the global signal shape and for both echoes relative amplitude.
Response from the top edges of notches
Transducers
The different simulations have been performed with 3 contact transducers with the following properties:
| Nominal frequency | Actual frequency | Crystal | Mode | Nominal refraction angle |
Actual refraction angle |
| 5 MHz | 4.85 MHz | Ø6.35 mm | P60 | 60° | 59° |
| P45 | 45° | 44.5° | |||
| P70 | 70° | 70° |
Configuration
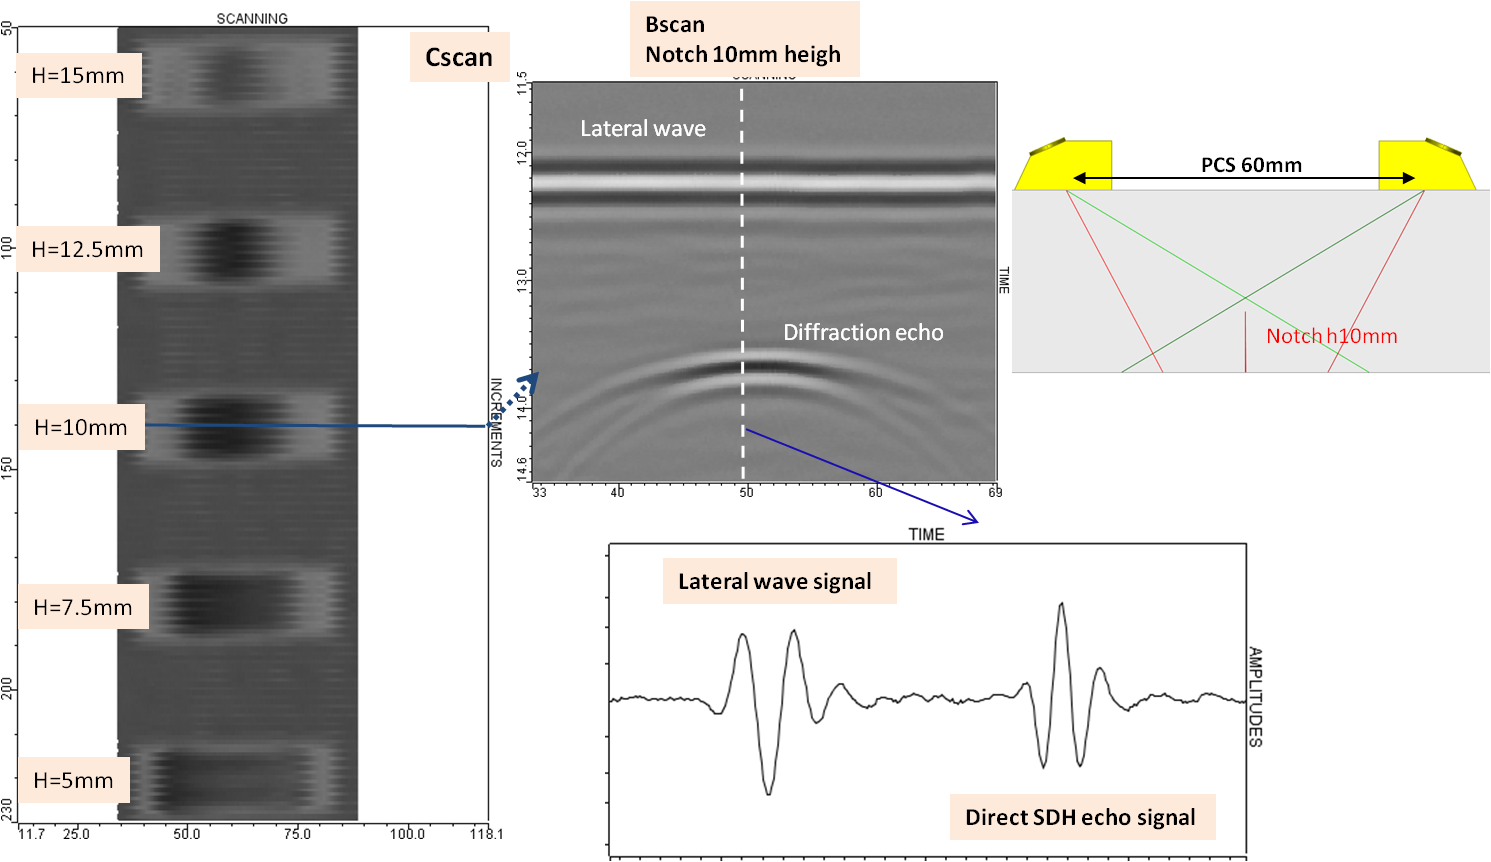
The mock-up used to evaluate the response from top edges of notches is a 30 mm thick planar block in which several backwall breaking notches have been embedded, as in the following figure:
These notches are 15 mm long and respectively: 0.5 mm, 1 mm, 1.5 mm, 2 mm, 3 mm, 4 mm, 5 mm, 7.5 mm, 10 mm, 12.5 mm and 15 mm high.
An example of experimental Cscan obtained during a TOFD inspection with P60 contact probes is displayed hereafter for a 60 mm PCS. The displayed echoes correspond to the top edge echoes from the 15, 12.5, 10, 7.5 and 5 mm high notches. One can note that the signal corresponding to the top edge diffraction and the lateral wave are in phase opposition.
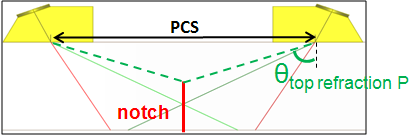
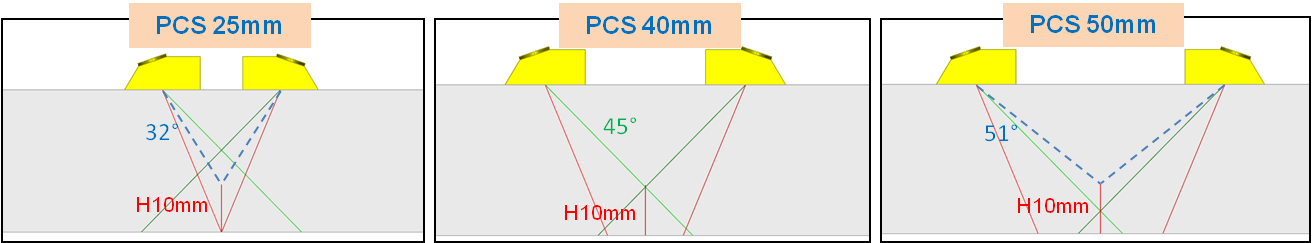
PCS Variation above the top edge of notches
The TOFD inspection has been performed on the test-specimen containing notches while varying the PCS. When the PCS increases, it can be noticed that:
- The theoretical P-waves axes intersect above and then under the top edge of the notches.
- The refraction angles of the incident rays on the top edge of the notches increase with the PCS.
For some notches and some PCS, the amplitude of the top edge diffraction echo has not been reported because this echo was mixed with the backwall echo (case of some small high notches) or because it was too weak.
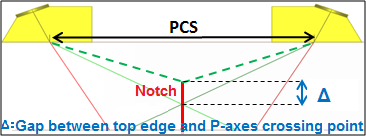
For each probe, the beam crossing depth has been measured relatively to the top edge of the notches, as well as the refraction angle on the top edge, for each PCS. The following figures explain these values.
Results on top edge of notches in P60 mode
The TOFD inspection has been performed on the specimen containing notches. It has been positioned so that the notches are backwall breaking. The PCS has been varied from 35 mm to 100 mm. The gap between the P-axes crossing depth and the top edge of the notch is given is the following table versus the PCS and the notch height:
| Gap to the crossing depth (mm) | PCS (mm) | ||||||||||||||
| 35 | 40 | 45 | 50 | 55 | 60 | 65 | 70 | 75 | 80 | 85 | 90 | 95 | 100 | ||
| Notch height (mm) | 4 | 7.2 | 5.8 | 4.3 | 2.9 | 1.4 | 0.0 | -1.5 | -2.9 | ||||||
| 5 | 9.1 | 7.7 | 6.2 | 4.8 | 3.3 | 1.9 | 0.4 | 0.0 | -1.5 | -2.9 | |||||
| 7.5 | 6.6 | 5.2 | 3.7 | 2.3 | 0.8 | -0.6 | -2.1 | -3.5 | -5.0 | -6.4 | |||||
| 10 | 8.4 | 7.0 | 5.5 | 4.1 | 2.7 | 1.2 | -0.2 | -1.7 | -3.1 | -4.6 | -6.0 | -7.5 | |||
| 12.5 | 7.4 | 5.9 | 4.5 | 3.0 | 1.6 | 0.2 | -1.3 | -2.7 | -4.2 | -5.6 | -7.1 | -8.5 | |||
| 15 | 4.9 | 3.4 | 2.0 | 0.5 | -0.9 | -2.3 | -3.8 | -5.2 | -6.7 | -8.1 | -9.6 | ||||
Moreover, the refraction angles on the top edge are given versus the PCS and the notch height:
| Refraction angle (°) | PCS (mm) | ||||||||||||||
| 35 | 40 | 45 | 50 | 55 | 60 | 65 | 70 | 75 | 80 | 85 | 90 | 95 | 100 | ||
| Notch height (mm) | 4 | 51 | 53 | 55 | 57 | 59 | 60 | 61 | 63 | ||||||
| 5 | 48 | 50 | 52 | 54 | 56 | 58 | 60 | 61 | 62 | 63 | |||||
| 7.5 | 51 | 53 | 55 | 57 | 59 | 61 | 62 | 63 | 65 | 66 | |||||
| 10 | 45 | 48 | 51 | 54 | 56 | 58 | 60 | 62 | 63 | 65 | 66 | 67 | |||
| 12.5 | 45 | 49 | 52 | 55 | 58 | 60 | 62 | 63 | 65 | 66 | 68 | 69 | |||
| 15 | 49 | 53 | 56 | 59 | 61 | 63 | 65 | 67 | 68 | 69 | 71 | ||||
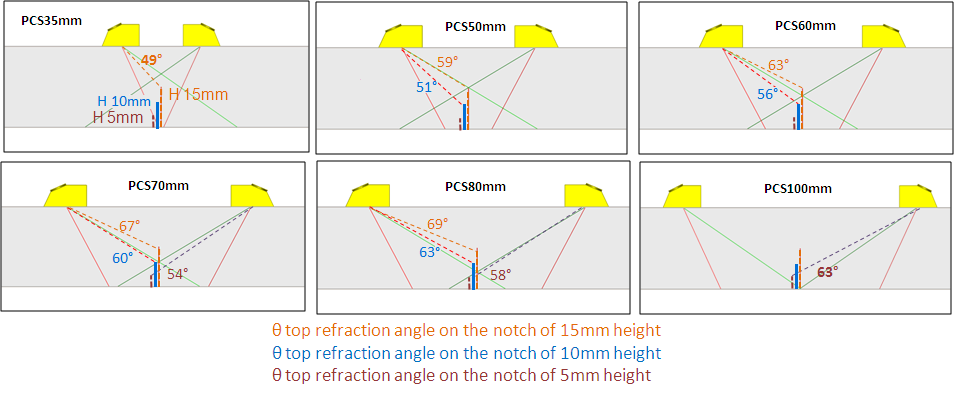
The minimum refraction angle is 45° (35 mm PCS, 12.5 mm notch) and the maximum refraction angle is 71° (85 mm PCS, 15 mm notch). Some echoes, mostly on notches smaller than 10 mm, have not been measured since they are too weak.
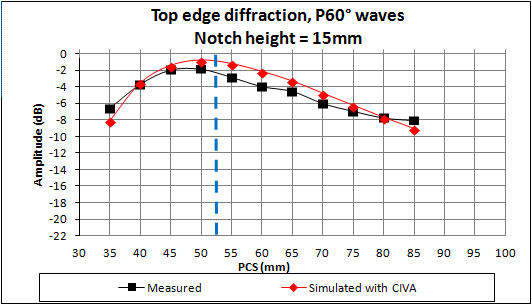
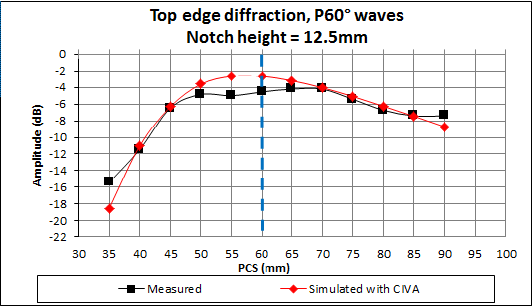
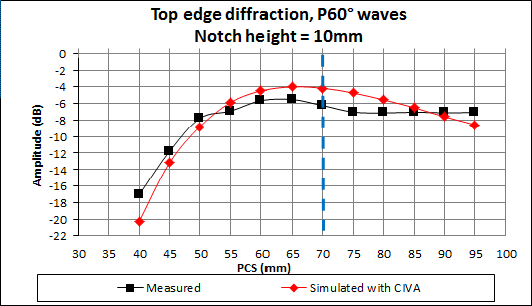
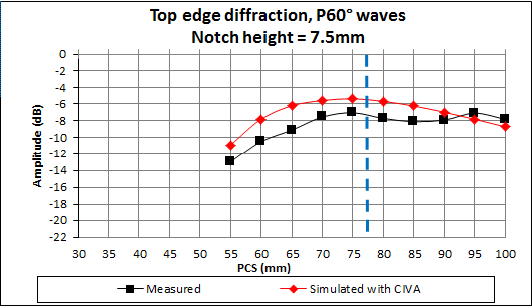
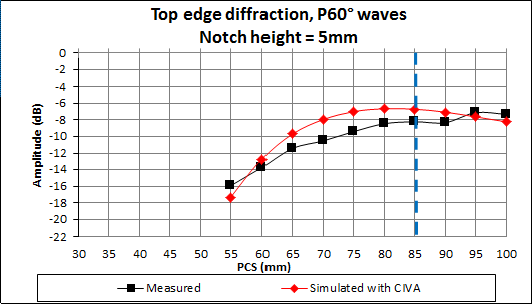
Maximum amplitudes on top edges of notches in P60 mode
Top edge diffraction echoes amplitudes are displayed hereafter for the different notch heights and for PCS from 35 to 100 mm. The experimental results are compared to simulations performed with CIVA 10. The results are calibrated versus the Ø2 mm SDH at 20 mm depth inspected with a 70 mm PCS.
The blue dotted line indicates the PCS for which the P-axes crossing depth matches the top edge of the notch.
 ;
; 
 ;
;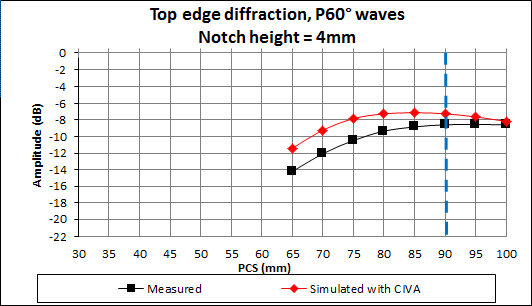
Whatever the notch height, the echo of maximum amplitude is obtained for the PCS corresponding to a P-axis crossing point that matches the top edge of the notch. A good agreement experiment/CIVA simulation is obtained for the behavior of the amplitude of the top edge echo: the maximum discrepancy is around 3 dB:
| Experiment / Simulation discrepancies (dB) | PCS (mm) | ||||||||||||||
| 35 | 40 | 45 | 50 | 55 | 60 | 65 | 70 | 75 | 80 | 85 | 90 | 95 | 100 | ||
| Notch height (mm) | 4 | 2.8 | 2.8 | 2.6 | 2.1 | 1.7 | 1.3 | 0.9 | 0.4 | ||||||
| 5 | -1.4 | 1.0 | 1.8 | 2.6 | 2.4 | 1.8 | 1.5 | 1.3 | -0.5 | -0.5 | |||||
| 7.5 | 2.1 | 2.7 | 2.9 | 2.0 | 1.7 | 2.0 | 1.8 | 0.9 | -0.7 | -0.9 | |||||
| 10 | -3.2 | -1.4 | -1.0 | 1.0 | 1.2 | 1.5 | 2.1 | 2.3 | 1.5 | 0.5 | -0.5 | -1.5 | |||
| 12.5 | -3.1 | 0.4 | 0.2 | 1.2 | 2.3 | 1.9 | 1.0 | 0.2 | 0.3 | 0.5 | -0.1 | -1.3 | |||
| 15 | -1.5 | 0.1 | 0.5 | 1.1 | 1.6 | 1.8 | 1.2 | 1.2 | 0.7 | 0.0 | -1.0 | ||||
A-scans and phase on the top edge of notches in P60 mode
The experimental (black) and simulated (red) Ascans obtained for top edge echoes on notches of different heights are displayed for 3 PCS (50, 70 and 90 mm) after amplitude normalization.
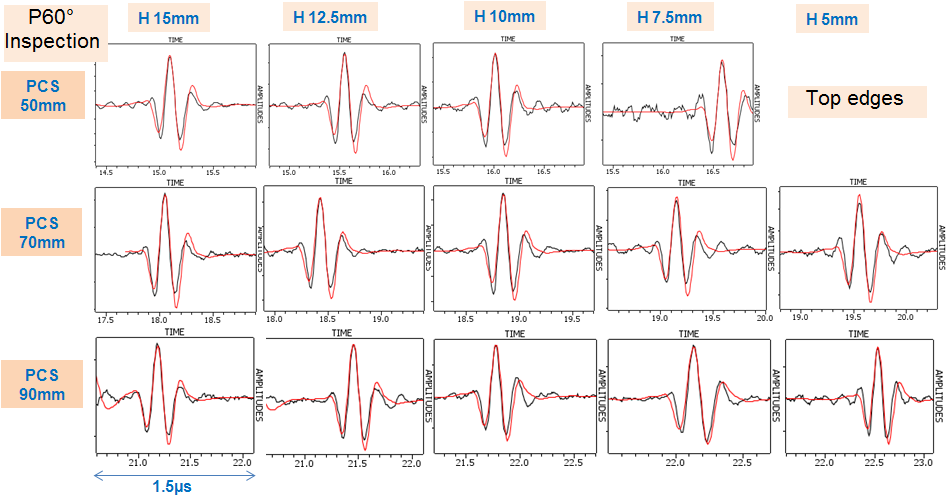
Simulated and experimental Ascans are very close. As the calibration of the input signal defined in CIVA for each probe has been performed on the waveform of the Ø2 mm SDH at 8 mm depth, the results highlight the fact that the waveforms are correctly simulated by CIVA.
In the case of the 15 mm notch, the time of flight discrepancies between the experimental and CIVA-simulated top edge diffraction echoes are from 0.2 µs to 0.4 µs, which is approximately the uncertainties on the measure of the time of flight.
Results on top edge of notches in P45 mode
The TOFD inspection has been performed on the specimen containing notches, positioned so that the notches are backwall breaking, while varying the PCS from 25 mm to 60 mm. The gap between the P-axes crossing depth and the top edge of the notch is given is the following table versus the PCS and the notch height:
| Gap to the crossing depth (mm) | PCS (mm) | ||||||||
| 25 | 30 | 35 | 40 | 45 | 50 | 55 | 60 | ||
| Notch height (mm) | 5 | 7.5 | 5.0 | 2.5 | 0.0 | -2.5 | -5.0 | ||
| 7.5 | 7.5 | 5.0 | 2.5 | 0.0 | -2.5 | -5.0 | -7.5 | ||
| 10 | 7.5 | 5.0 | 2.5 | 0.0 | -2.5 | -5.0 | -7.5 | -10 | |
| 12.5 | 5.0 | 2.5 | 0.0 | -2.5 | -5.0 | -7.5 | -10 | -12.5 | |
| 15 | 2.5 | 0.0 | -2.5 | -5.0 | -7.5 | -10 | -12.5 | -15 | |
The following table reports the refraction angles on the top edge versus the PCS and the notch height:
| Refraction angle (°) | PCS (mm) | ||||||||
| 25 | 30 | 35 | 40 | 45 | 50 | 55 | 60 | ||
| Notch height (mm) | 5 | 35 | 39 | 42 | 45 | 48 | 50 | ||
| 7.5 | 34 | 38 | 42 | 45 | 48 | 51 | 53 | ||
| 10 | 32 | 37 | 41 | 45 | 48 | 51 | 54 | 56 | |
| 12.5 | 36 | 41 | 45 | 49 | 52 | 55 | 58 | 60 | |
| 15 | 40 | 45 | 49 | 53 | 56 | 59 | 61 | 63 | |
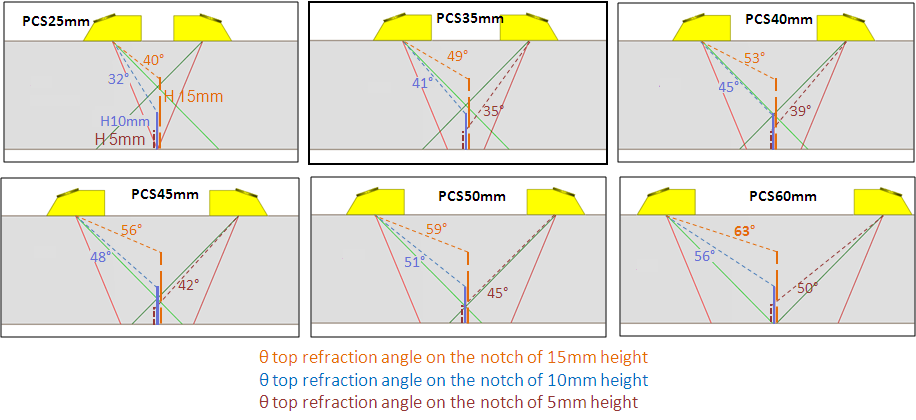
The minimum refraction angle is 32° (25 mm PCS, 10 mm notch) and the maximum refraction angle is 63° (60 mm PCS, 15 mm notch).
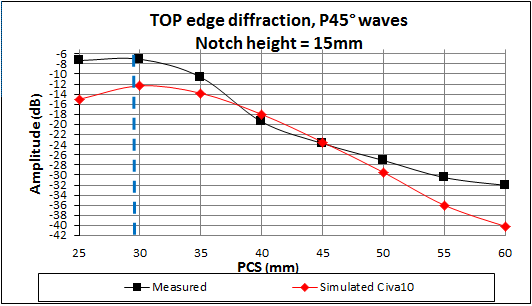
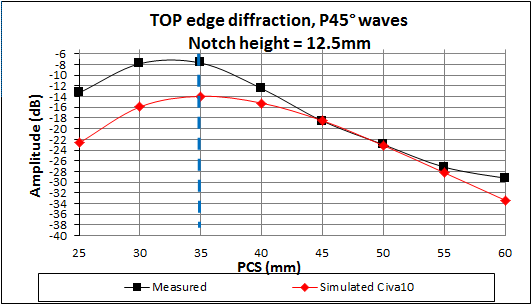
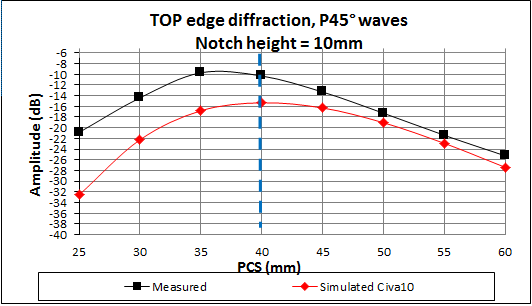
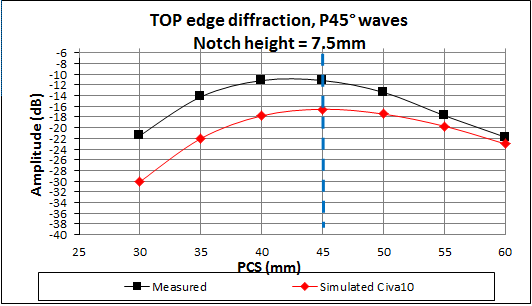
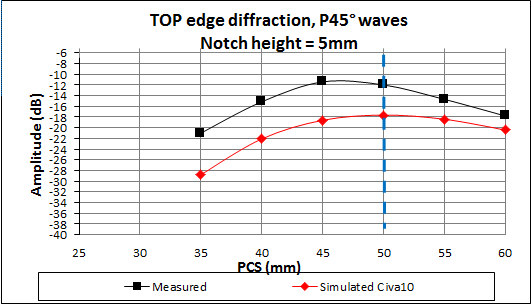
Maximum amplitudes on top edges of notches in P45 mode
Top edge diffraction echoes amplitudes are displayed hereafter for different notch heights and PCS from 25 to 60 mm. The experimental results are compared to simulations performed with CIVA 10. The results are calibrated versus the Ø2 mm SDH at 20 mm depth inspected with a 40 mm PCS.
The blue dotted line indicates the PCS for which the P-axes crossing point matches the top edge of the notch.
 ;
; 
The discrepancies between experimental and CIVA 10 simulated amplitudes are displayed in the next table:
| Experiment / Simulation discrepancies (dB) | PCS (mm) | ||||||||
| 25 | 30 | 35 | 40 | 45 | 50 | 55 | 60 | ||
| Notch height (mm) | 5 | -7.8 | -6.9 | -7.2 | -5.6 | -3.7 | -2.6 | ||
| 7.5 | -8.6 | -7.8 | -6.6 | -5.4 | -4.1 | -2.0 | -1.3 | ||
| 10 | -11.7 | -7.8 | -7.1 | -5.0 | -3.0 | -1.8 | -1.5 | -2.2 | |
| 12.5 | -9.4 | -8.1 | -6.2 | -2.7 | 0.1 | -0.2 | -1.1 | -4.1 | |
| 15 | -7.7 | -5.3 | -3.2 | 1.5 | 0.3 | -2.4 | -5.5 | -7.8 | |
Contrary to the previous P60 case, the comparison of simulated and experimental results show strong discrepancies for small PCS and also when the P-axes crossing point is at the depth of the top edge. For small PCS, the measured discrepancies are generally around 6 dB and up to 11 dB, the response is under-estimated for all notch heights. The higher is the PCS, the weaker are the discrepancies, particularly for high notches. The reasons of these discrepancies will be discussed later.
Ascans and phase on the top edge of notches in P45 mode
Experimental (black) and simulated (red) Ascans obtained for top edge echoes on notches of different heights are displayed for 3 PCS (25, 40 and 50 mm) after amplitude normalization.
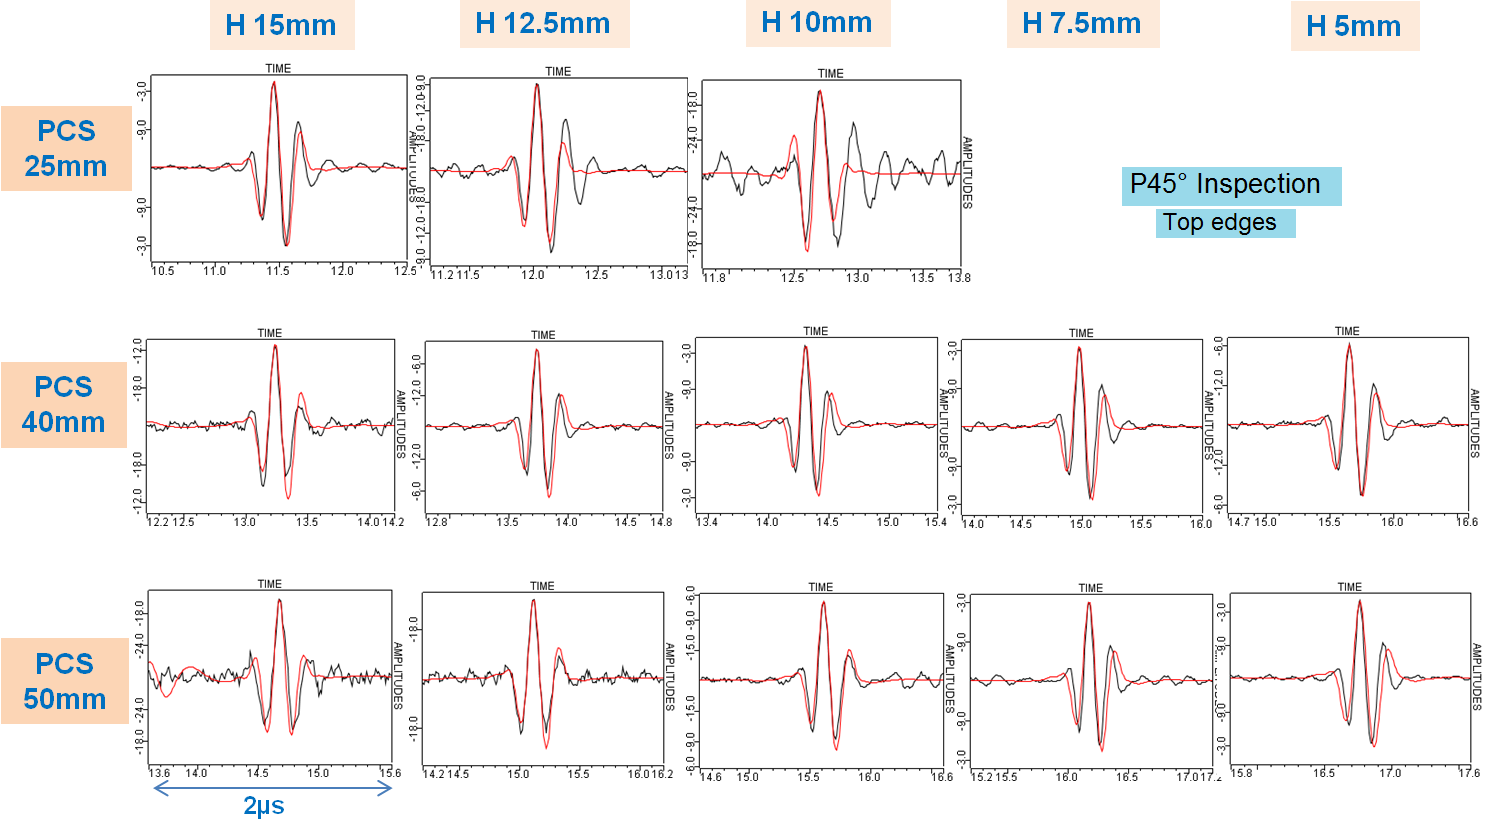
Simulated Ascans are close to experimental Ascans, except for the 10 mm notch and the 25 mm PCS. In this case the experimental A-scan is longer, which means with a smaller bandwidth, than the simulated Ascan. For each PCS, the simulated Ascan from the 10 mm notch shows a phase shift compared to those from the 15 and 12.5 mm notches. This phase shift also appears in experimental Ascans but is weaker. Moreover, the simulated echo is slightly too “low frequency” for 50 mm PCS with 7.5 and 5 mm notches.
Results on top edge of notches in P70 mode
The TOFD inspection has been performed on the 15 mm backwall breaking notch of the specimen containing various notches. The PCS varies from 35 mm to 120 mm. The gap between the P-axes crossing depth and the top edge of the notch is given in the following table versus the PCS:
| Gap to the crossing depth (mm) | PCS (mm) | |||||||||||||||
| 40 | 45 | 50 | 55 | 60 | 65 | 70 | 75 | 80 | 85 | 90 | 95 | 100 | 105 | 110 | 120 | |
| Notch height: 15 mm | 7.7 | 6.8 | 5.9 | 5.0 | 4.1 | 3.1 | 2.2 | 1.3 | 0.4 | -0.5 | -1.4 | -2.3 | -3.2 | -4.1 | -5.1 | -6.9 |
Moreover, the refraction angles on the top edge are given versus the PCS and the notch height:
| Refraction angle (dB) | PCS (mm) | ||||||||||||||||
| 35 | 40 | 45 | 50 | 55 | 60 | 65 | 70 | 75 | 80 | 85 | 90 | 90 | 100 | 105 | 110 | 120 | |
| Notch height: 15 mm | 49 | 53 | 56 | 59 | 61 | 63 | 65 | 67 | 68 | 69 | 71 | 72 | 72 | 73 | 74 | 75 | 76 |
The minimum refraction angle is 49° (35 mm PCS) and the maximum refraction angle is 76° (120 mm PCS).
Maximum amplitudes on top edges of notches in P70 mode
Top edge diffraction echoes amplitudes are displayed hereafter for PCS from 35 to 120 mm. The experimental results are compared to simulations performed with CIVA 10. The results are calibrated versus the Ø0.7 mm SDH at 10 mm depth inspected with a 55 mm PCS.
The blue dotted line indicates the PCS for which the P-axes crossing depth matches the top edge of the notch.
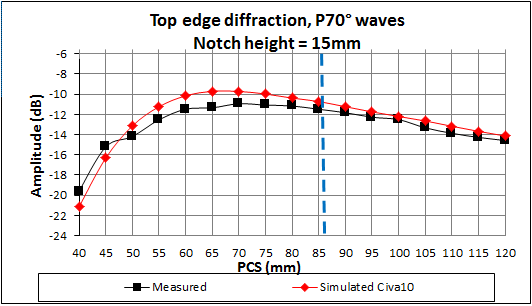
| PCS (mm) | 40 | 45 | 50 | 55 | 60 | 65 | 70 | 75 | 80 | 85 | 90 | 95 | 100 | 105 | 110 | 115 | 120 |
| Experiment / Simulation discrepancies | -1.6 | -1.1 | 1.0 | 1.3 | 1.3 | 1.6 | 1.2 | 1.1 | 0.8 | 0.8 | 0.6 | 0.5 | 0.3 | 0.7 | 0.7 | 0.6 | 0.4 |
These amplitudes show a good agreement (discrepancies lower than 2 dB).
Response from bottom edges of notches
After testing experimental reproducibility of the response from bottom edges of notches, some amplitude differences were observed. To explain the cause of those discrepancies, new experimental tests are in progress. The new results will be soon reported.