
UT – Multiple echoes: Results for the 5 MHz phased array probe generating T45° waves with different focusing sound paths
Summary
Results with a vertical notch
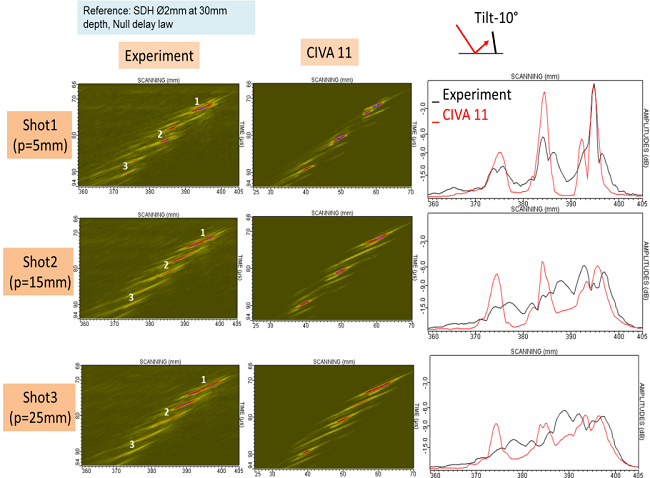
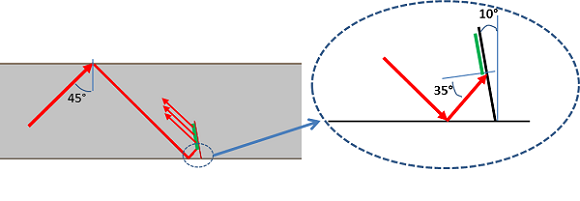
The figure below is an experimental Cscan obtained during inspection of a vertical notch with 3 focusing points at 5, 15 and 25 mm depth.
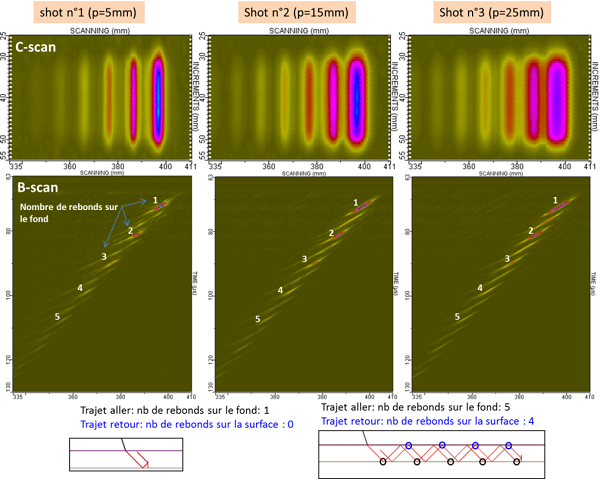
Echoes with greater amplitude (numbered from 1 to 5) correspond to paths for which the difference between the number of skips on the backwall during transmit (probe–>notch path) and the number of skips for the notch–>probe path is equal to 1. Examples of these paths that are associated with specular echoes are presented on the figure above for echo n°1 (path with 1 skip on the backwall and no skip during round-trip) and echo n°5 (path with 5 skips on the backwall and 4 on the surface).
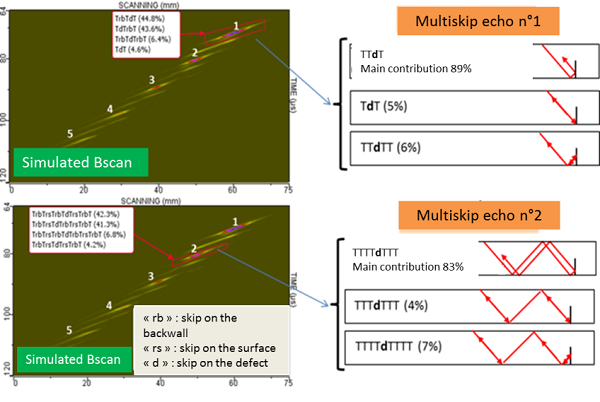
Other diffraction echoes (with less amplitude) mix themselves with specular echoes. The global amplitude of the echoes n° 1 to 5 (specular + diffraction) will be compared later in the document. They will be named “multi-skip” echoes n°1, n°2, etc.
In the following, we will make comparisons between experiments and simulations with CIVA 11.
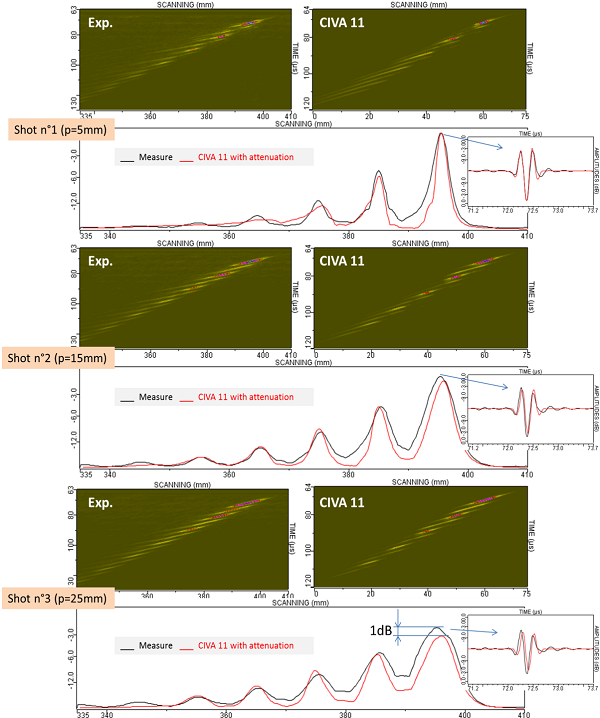
The figure below represents experimental and simulated Bscans extracted at the center of the defect for each shot. A superposition of echodynamics and Ascans for the first corner echo is also presented for each shot. It allows to check that experimental and simulated amplitudes are quite similar. The maximal difference that is measured is 2 dB. Experimental and simulated Ascans are also in good agreement. However, echodynamic curves show that experimental ones are wider than simulated ones for every focusing depths.
Results with an opened tilt angle configuration
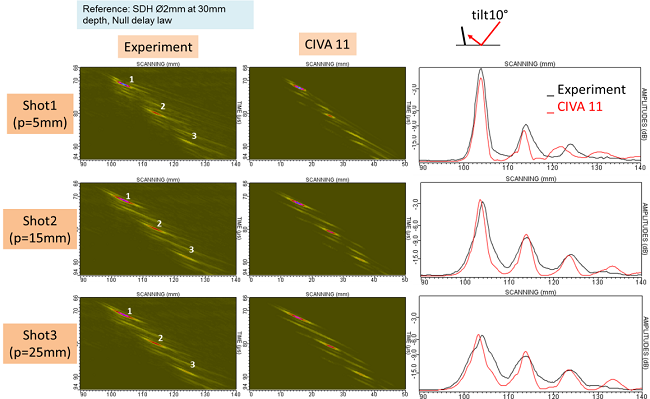
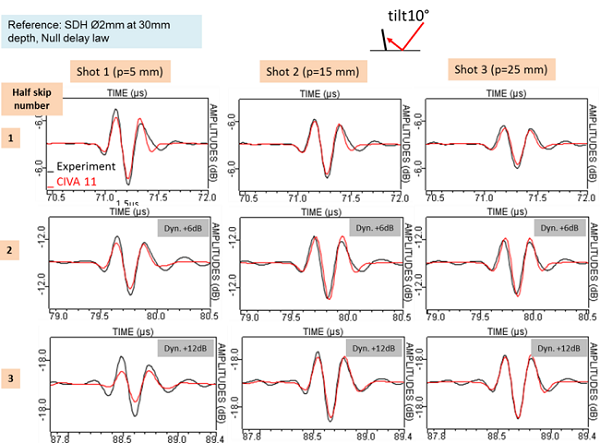
The figure below shows comparisons between experimental and simulated Bscans and echodynamics curves for the 10° tilted notch. There is a good agreement between experiments and simulations for the 3 shots. Furthermore, as for the vertical notch, experimental echoes are wider than simulated ones (see echodynamic curves).
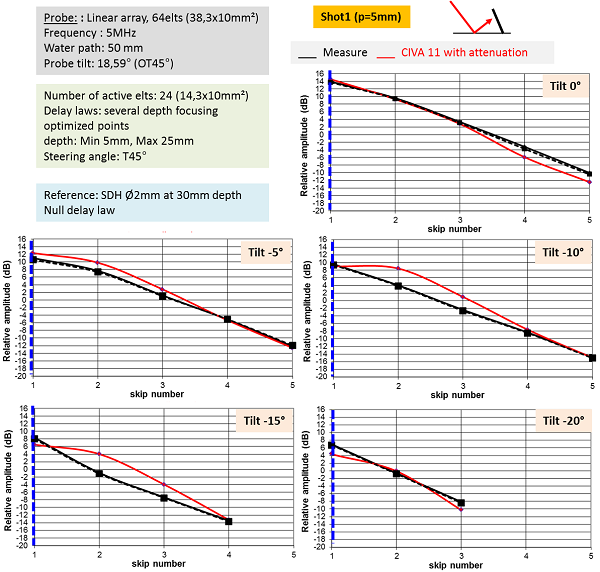
The amplitude of experimental and simulated echoes evolution for each tilt angle and shot is presented on the figure below.
The blue dotted line on the graphs is located at the depth for which the focusing is applied ( 1 = 5 mm, 2 = 15 mm et 3 = 25 mm).
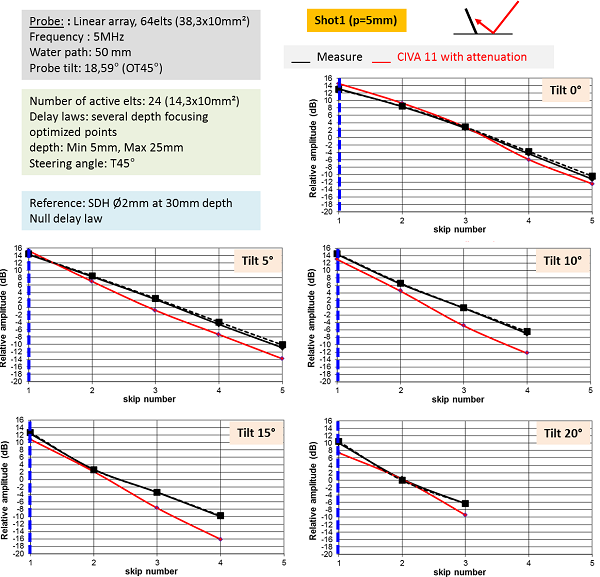
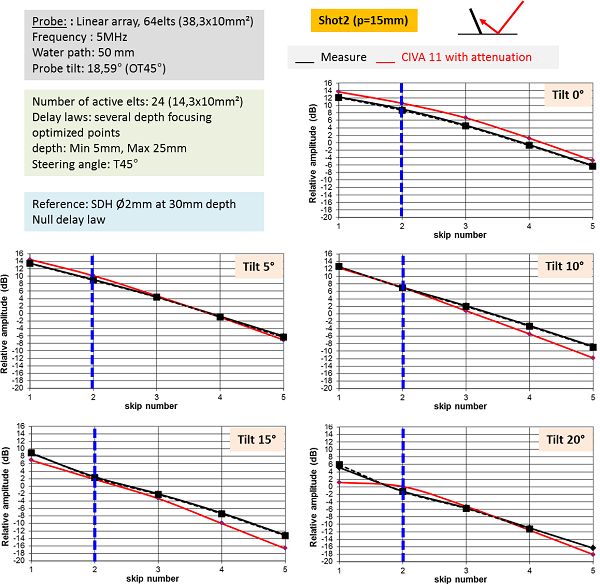
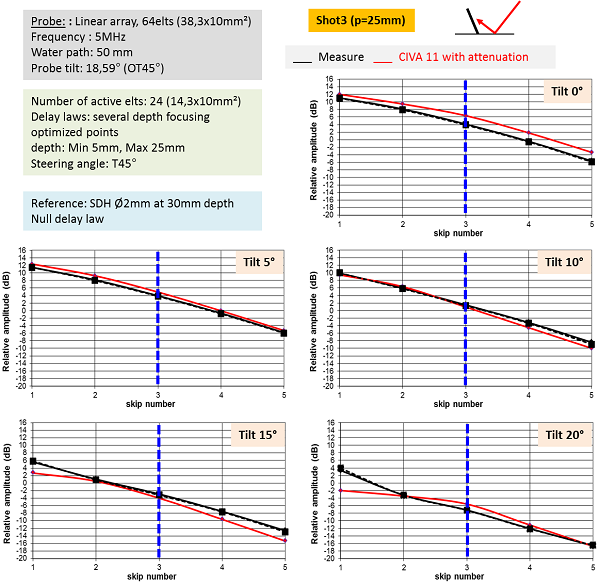
The amplitude evolution with the number of skips is well predicted by CIVA 11. However, there are differences that can reach 6 dB on the first corner echo when the notch is tilted with an angle of 15° or 20° and when the focusing depth is larger than the backwall specimen depth (shots n°2 and n°3). Furthermore for shot n°1, the difference between experiment and simulation increases with the number of skips.
The comparison of experimental and simulated Ascans of the 10° tilted notch shows that the shape and the amplitude of the echoes are in good agreement for the 3 shots.
Results with a closed tilt angle configuration
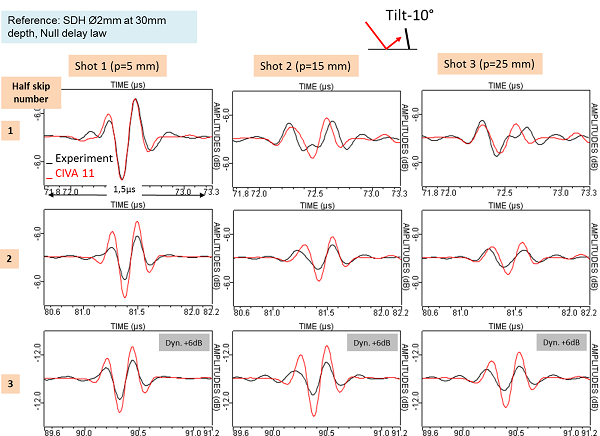
The figure below shows comparisons between experimental and simulated Bscans and echodynamics curves for the -10° tilted notch. The superposition of experimental and simulated echodynamic curves is also presented.
Starting from echo n°2, important differences of amplitude and echodynamic curves shape appear. In order to check that it is not due to the fact that mode conversion were not taken into account, simulations with attenuation were performed. There is no difference between results with or without mode conversion for multi-skip echoes n°1 and n°2. Therefore, the differences of amplitude and response shape are not due to the simplification of the model limited to T waves only.
The 3 following figures show the evolution of the echoes amplitude in function of the number of skips for the 3 studied shots.
The blue dotted line on the graphs is located at the depth for which the focusing is applied ( 1 = 5 mm, 2 = 15 mm et 3 = 25 mm).
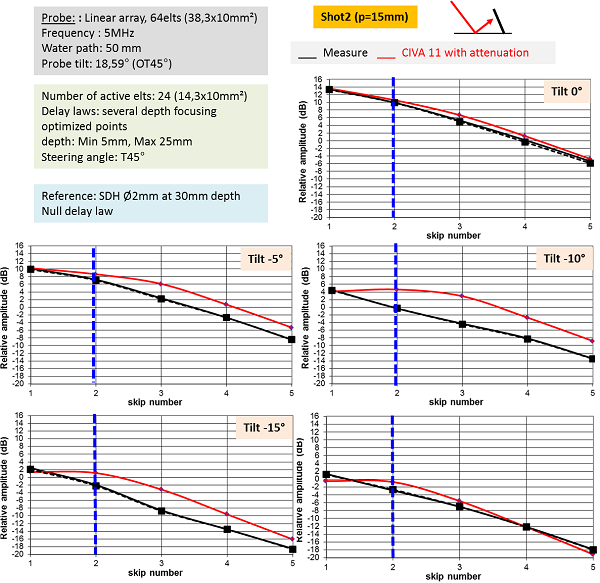
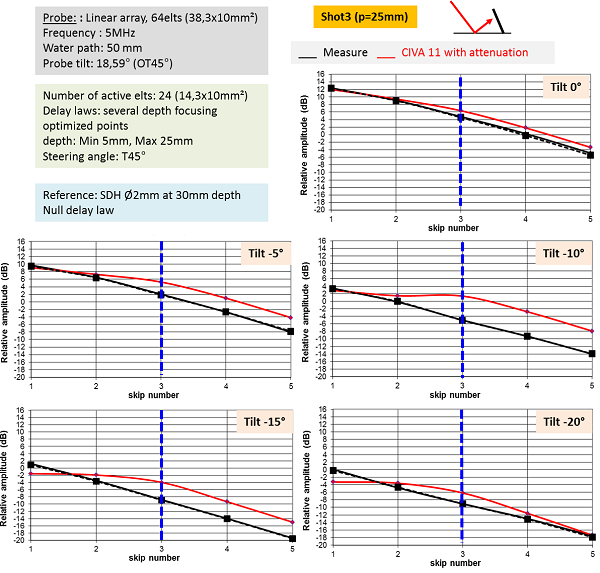
CIVA 11 predictions for not almost tilted notches (0° and -5°) are good (differences lower than 3 dB). However, for larger tilt angles, simulated curves present a plateau in amplitude wherever amplitude decreases linearly in experiment. CIVA 11 predicts a quite constant amplitude until the focus point which is represented by the blue dotted line on the graphs. The difference between experimental and simulated amplitudes can reach 7 dB. These differences, especially for the -10° tilted notch, may be due to the contribution of creeping waves and head waves which are not calculated by CIVA 11. Indeed, they lead to additional contribution that mix themselves with bulk waves (see figure below).
The figure below shows superposition of experimental and simulated Ascans associated with the -10° tilted notch. The results are presented for the 3 shots and for the 3 first multiskip echoes. There is a good agreement between CIVA and the experiment for the first corner echo. Simulated Ascans for shots n°2 and 3 present a simulated amplitude slightly larger than the one of experimental ones. However, the shape stays in good agreement.
CONCLUSION
Backwall breaking notches located in a planar specimen of 5 mm width were inspected with T45° waves with a phased-array probe used in immersion configuration. The flaws were detected after 1 up to 5 skips on the backwall. Three delay laws were used to focus T45°waves at 5, 15 and 25 mm depth. The notches were 2 mm height, 20 mm long and tilted from -20° to 20° with 5° step.
Multi-skip corner echoes amplitude decreases linearly when the number of skips increases. This is true for all tilt angles and all focusing depths. This decrease is well predicted by CIVA 11 when the inspection is made on a “opened tilt” angle configuration. However, there are differences for tilts larger than 5° when the focusing is performed at 5 mm depth. At this focusing depth, we observe differences in amplitude that increase with the number of skips.
For closed tilt angles, the linear experimental decrease of the amplitude is not accuratly predicted by CIVA 11. In simulation, we observe a plateau in amplitude for the 2 or 3 first multi-skip echoes, especially for notches with -10° to -20° tilt. The differences can reach 7 dB for the -10° tilted notch.
In addition to differences in amplitude, there are also differences in the echodynamic curves. CIVA 11 predicts curves narrower than experimental ones. This may be due to contributions of creeping and head waves which are not taken into account during calculation in CIVA.