
UT – TOFD : Results on the top edge of a vertical notch
Summary
- Transducers
- Configuration
- PCS Variation above the top edge of notches
- Results on top edge of notches in P60 mode
- Maximum amplitudes on top edges of notches in P60 mode
- A-scans and phase on the top edge of notches in P60 mode
- Results on top edge of notches in P45 mode
- Maximum amplitudes on top edges of notches in P45 mode
- Ascans and phase on the top edge of notches in P45 mode
- Results on top edge of notches in P70 mode
- Maximum amplitudes on top edges of notches in P70 mode
- Conclusion
- Notch aperture
- 2D GTD modeling
Transducers
The different simulations have been performed with 3 contact transducers with the following properties:
| Nominal frequency | Actual frequency | Crystal | Mode | Nominal refraction angle |
Actual refraction angle |
| 5 MHz | 4.85 MHz | Ø6.35 mm | P60 | 60° | 59° |
| P45 | 45° | 44.5° | |||
| P70 | 70° | 70° |
Configuration
The mock-up used to evaluate the response from top edges of notches is a 30 mm thick planar block in which several backwall breaking notches have been embedded, as in the following figure:
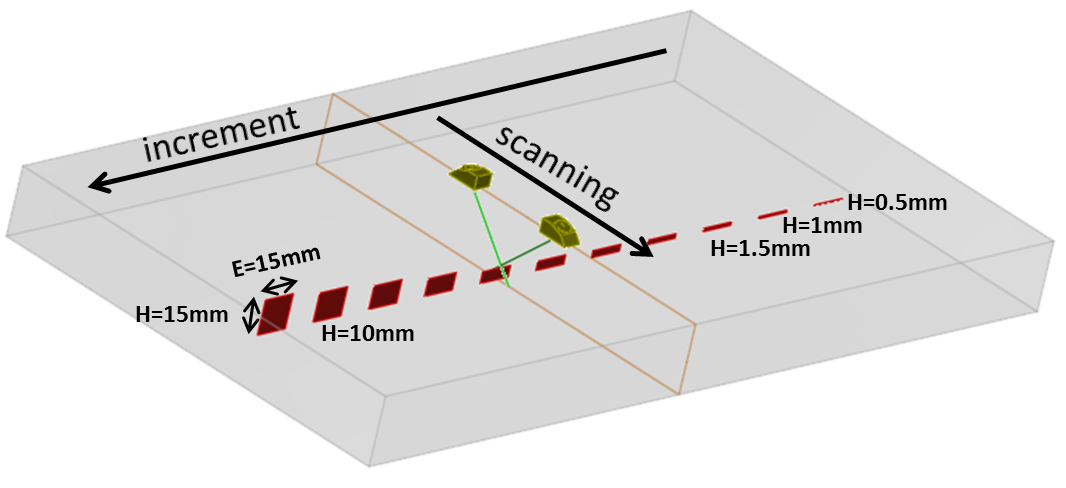
These notches are 15 mm long and respectively: 0.5 mm, 1 mm, 1.5 mm, 2 mm, 3 mm, 4 mm, 5 mm, 7.5 mm, 10 mm, 12.5 mm and 15 mm high.
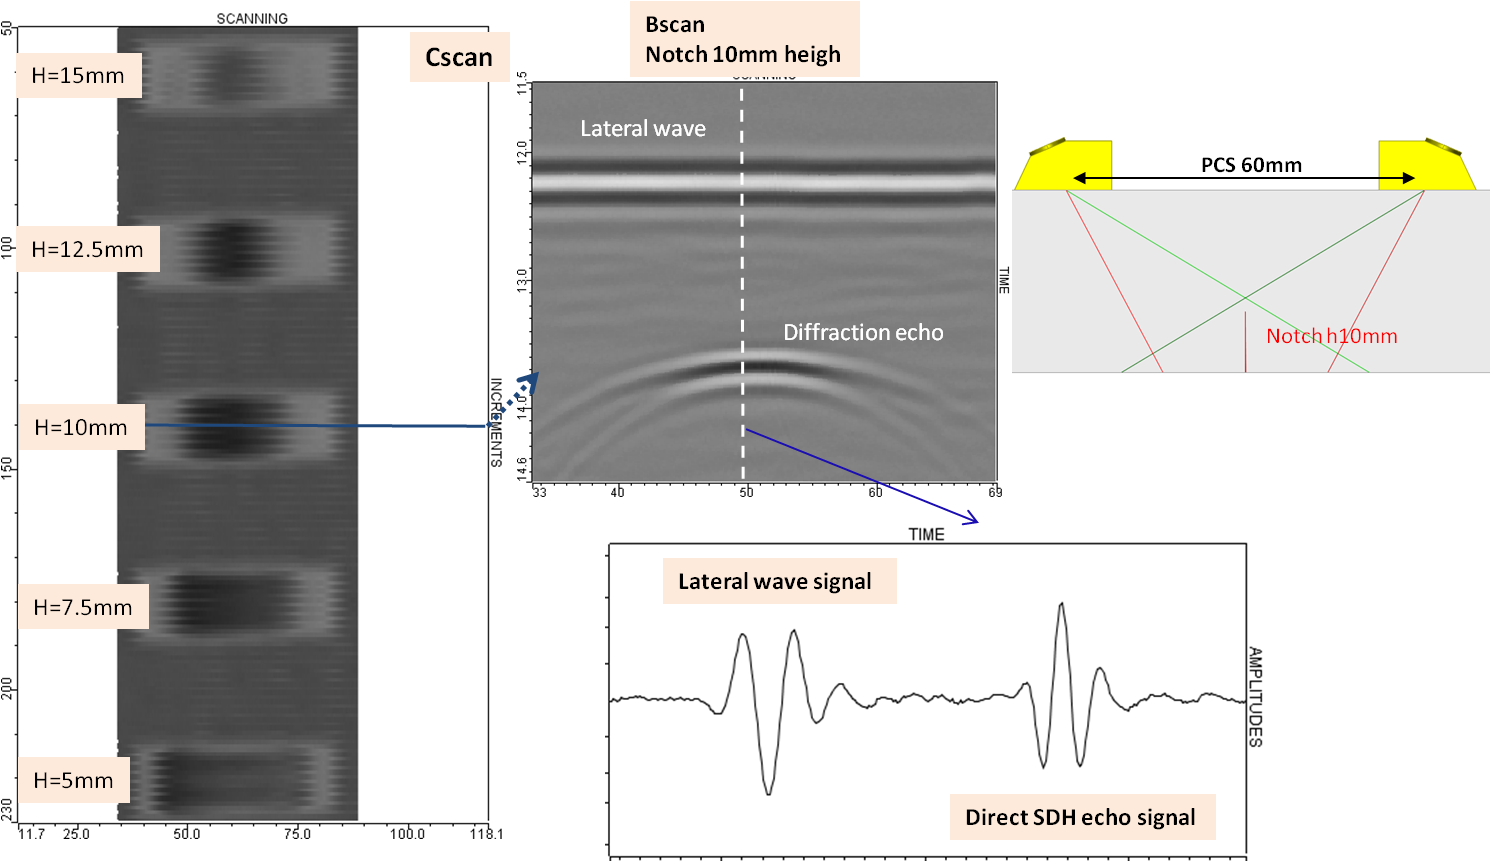
An example of experimental Cscan obtained during a TOFD inspection with P60 contact probes is displayed hereafter for a 60 mm PCS. The displayed echoes correspond to the top edge echoes from the 15, 12.5, 10, 7.5 and 5 mm high notches. One can note that the signal corresponding to the top edge diffraction and the lateral wave are in phase opposition.
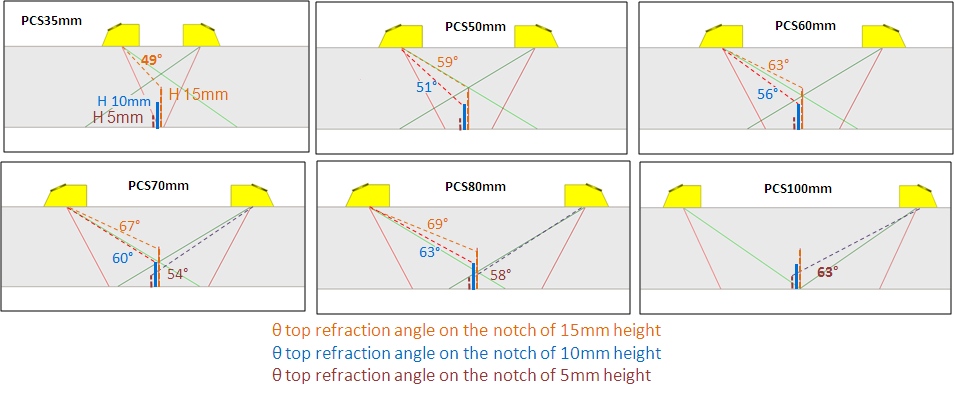
PCS Variation above the top edge of notches
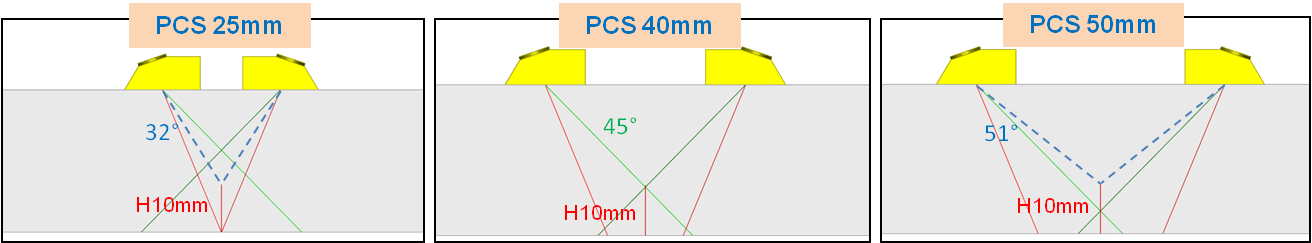
The TOFD inspection has been performed on the test-specimen containing notches while varying the PCS. When the PCS increases, it can be noticed that:
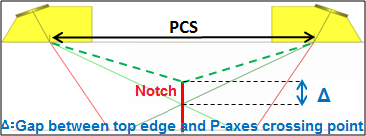
- The theoretical P-waves axes intersect above and then under the top edge of the notches.
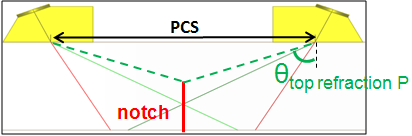
- The refraction angles of the incident rays on the top edge of the notches increase with the PCS.
For some notches and some PCS, the amplitude of the top edge diffraction echo has not been reported because this echo was mixed with the backwall echo (case of some small high notches) or because it was too weak.
For each probe, the beam crossing depth has been measured relatively to the top edge of the notches, as well as the refraction angle on the top edge, for each PCS. The following figures explain these values.
Results on top edge of notches in P60 mode
The TOFD inspection has been performed on the specimen containing notches. It has been positioned so that the notches are backwall breaking. The PCS has been varied from 35 mm to 100 mm. The gap between the P-axes crossing depth and the top edge of the notch is given is the following table versus the PCS and the notch height:
| Gap to the crossing depth (mm) | PCS (mm) | ||||||||||||||
| 35 | 40 | 45 | 50 | 55 | 60 | 65 | 70 | 75 | 80 | 85 | 90 | 95 | 100 | ||
| Notch height (mm) | 4 | 7.2 | 5.8 | 4.3 | 2.9 | 1.4 | 0.0 | -1.5 | -2.9 | ||||||
| 5 | 9.1 | 7.7 | 6.2 | 4.8 | 3.3 | 1.9 | 0.4 | 0.0 | -1.5 | -2.9 | |||||
| 7.5 | 6.6 | 5.2 | 3.7 | 2.3 | 0.8 | -0.6 | -2.1 | -3.5 | -5.0 | -6.4 | |||||
| 10 | 8.4 | 7.0 | 5.5 | 4.1 | 2.7 | 1.2 | -0.2 | -1.7 | -3.1 | -4.6 | -6.0 | -7.5 | |||
| 12.5 | 7.4 | 5.9 | 4.5 | 3.0 | 1.6 | 0.2 | -1.3 | -2.7 | -4.2 | -5.6 | -7.1 | -8.5 | |||
| 15 | 4.9 | 3.4 | 2.0 | 0.5 | -0.9 | -2.3 | -3.8 | -5.2 | -6.7 | -8.1 | -9.6 | ||||
Moreover, the refraction angles on the top edge are given versus the PCS and the notch height:
| Refraction angle (°) | PCS (mm) | ||||||||||||||
| 35 | 40 | 45 | 50 | 55 | 60 | 65 | 70 | 75 | 80 | 85 | 90 | 95 | 100 | ||
| Notch height (mm) | 4 | 51 | 53 | 55 | 57 | 59 | 60 | 61 | 63 | ||||||
| 5 | 48 | 50 | 52 | 54 | 56 | 58 | 60 | 61 | 62 | 63 | |||||
| 7.5 | 51 | 53 | 55 | 57 | 59 | 61 | 62 | 63 | 65 | 66 | |||||
| 10 | 45 | 48 | 51 | 54 | 56 | 58 | 60 | 62 | 63 | 65 | 66 | 67 | |||
| 12.5 | 45 | 49 | 52 | 55 | 58 | 60 | 62 | 63 | 65 | 66 | 68 | 69 | |||
| 15 | 49 | 53 | 56 | 59 | 61 | 63 | 65 | 67 | 68 | 69 | 71 | ||||
The minimum refraction angle is 45° (35 mm PCS, 12.5 mm notch) and the maximum refraction angle is 71° (85 mm PCS, 15 mm notch). Some echoes, mostly on notches smaller than 10 mm, have not been measured since they are too weak.
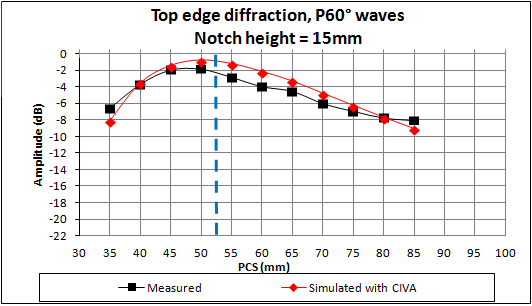
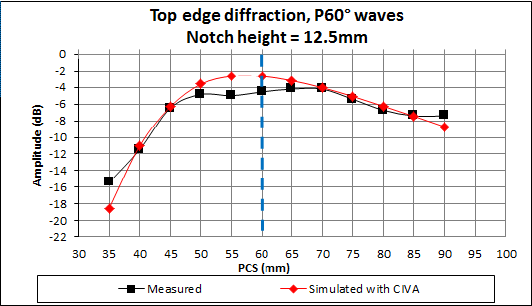
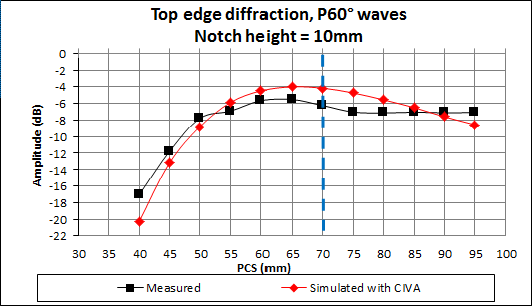
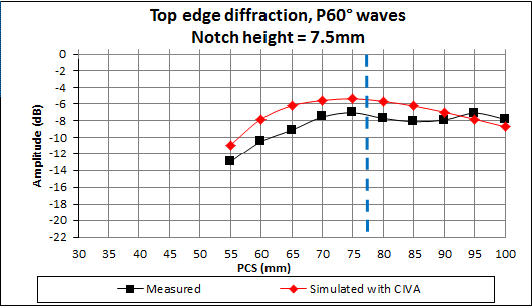
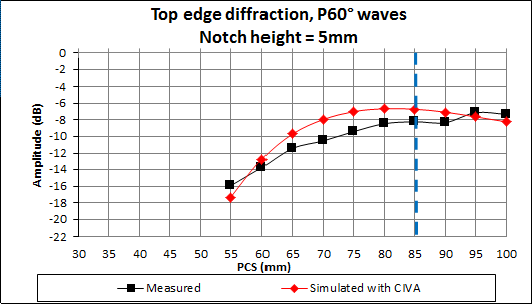
Maximum amplitudes on top edges of notches in P60 mode
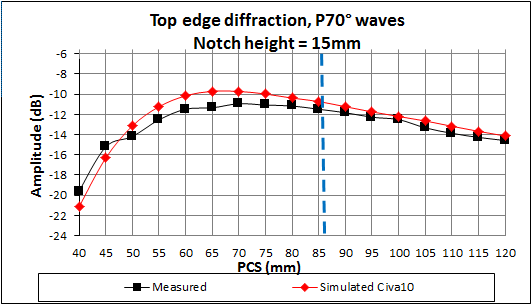
Top edge diffraction echoes amplitudes are displayed hereafter for the different notch heights and for PCS from 35 to 100 mm. The experimental results are compared to simulations performed with CIVA 10. The results are calibrated versus the Ø2 mm SDH at 20 mm depth inspected with a 70 mm PCS.
The blue dotted line indicates the PCS for which the P-axes crossing depth matches the top edge of the notch.
 ;
; 
 ;
;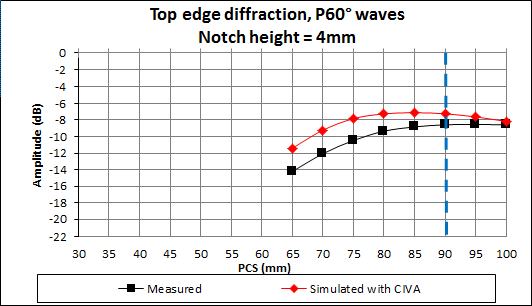
Whatever the notch height, the echo of maximum amplitude is obtained for the PCS corresponding to a P-axis crossing point that matches the top edge of the notch. A good agreement experiment/CIVA simulation is obtained for the behavior of the amplitude of the top edge echo: the maximum discrepancy is around 3 dB:
| Experiment / Simulation discrepancies (dB) | PCS (mm) | ||||||||||||||
| 35 | 40 | 45 | 50 | 55 | 60 | 65 | 70 | 75 | 80 | 85 | 90 | 95 | 100 | ||
| Notch height (mm) | 4 | 2.8 | 2.8 | 2.6 | 2.1 | 1.7 | 1.3 | 0.9 | 0.4 | ||||||
| 5 | -1.4 | 1.0 | 1.8 | 2.6 | 2.4 | 1.8 | 1.5 | 1.3 | -0.5 | -0.5 | |||||
| 7.5 | 2.1 | 2.7 | 2.9 | 2.0 | 1.7 | 2.0 | 1.8 | 0.9 | -0.7 | -0.9 | |||||
| 10 | -3.2 | -1.4 | -1.0 | 1.0 | 1.2 | 1.5 | 2.1 | 2.3 | 1.5 | 0.5 | -0.5 | -1.5 | |||
| 12.5 | -3.1 | 0.4 | 0.2 | 1.2 | 2.3 | 1.9 | 1.0 | 0.2 | 0.3 | 0.5 | -0.1 | -1.3 | |||
| 15 | -1.5 | 0.1 | 0.5 | 1.1 | 1.6 | 1.8 | 1.2 | 1.2 | 0.7 | 0.0 | -1.0 | ||||
A-scans and phase on the top edge of notches in P60 mode
The experimental (black) and simulated (red) Ascans obtained for top edge echoes on notches of different heights are displayed for 3 PCS (50, 70 and 90 mm) after amplitude normalization.
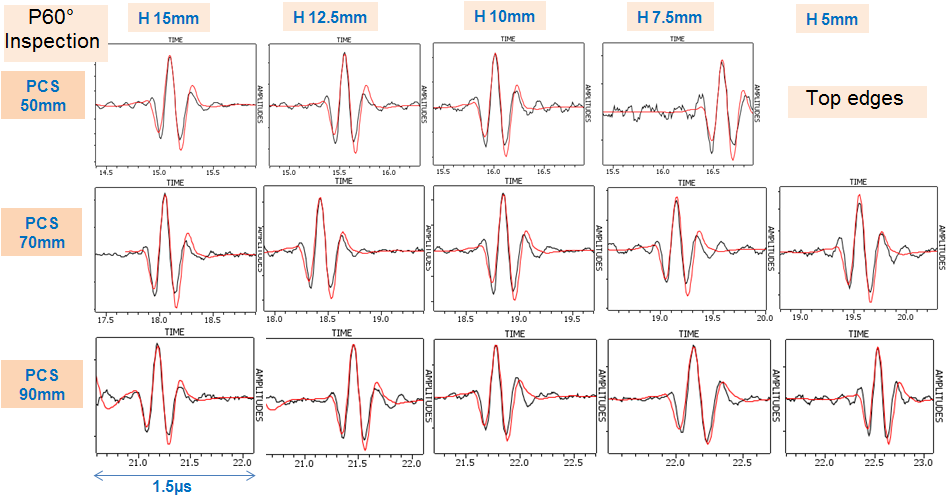
Simulated and experimental Ascans are very close. As the calibration of the input signal defined in CIVA for each probe has been performed on the waveform of the Ø2 mm SDH at 8 mm depth, the results highlight the fact that the waveforms are correctly simulated by CIVA.
In the case of the 15 mm notch, the time of flight discrepancies between the experimental and CIVA-simulated top edge diffraction echoes are from 0.2 µs to 0.4 µs, which is approximately the uncertainties on the measure of the time of flight.
Results on top edge of notches in P45 mode
The TOFD inspection has been performed on the specimen containing notches, positioned so that the notches are backwall breaking, while varying the PCS from 25 mm to 60 mm. The gap between the P-axes crossing depth and the top edge of the notch is given is the following table versus the PCS and the notch height:
| Gap to the crossing depth (mm) | PCS (mm) | ||||||||
| 25 | 30 | 35 | 40 | 45 | 50 | 55 | 60 | ||
| Notch height (mm) | 5 | 7.5 | 5.0 | 2.5 | 0.0 | -2.5 | -5.0 | ||
| 7.5 | 7.5 | 5.0 | 2.5 | 0.0 | -2.5 | -5.0 | -7.5 | ||
| 10 | 7.5 | 5.0 | 2.5 | 0.0 | -2.5 | -5.0 | -7.5 | -10 | |
| 12.5 | 5.0 | 2.5 | 0.0 | -2.5 | -5.0 | -7.5 | -10 | -12.5 | |
| 15 | 2.5 | 0.0 | -2.5 | -5.0 | -7.5 | -10 | -12.5 | -15 | |
The following table reports the refraction angles on the top edge versus the PCS and the notch height:
| Refraction angle (°) | PCS (mm) | ||||||||
| 25 | 30 | 35 | 40 | 45 | 50 | 55 | 60 | ||
| Notch height (mm) | 5 | 35 | 39 | 42 | 45 | 48 | 50 | ||
| 7.5 | 34 | 38 | 42 | 45 | 48 | 51 | 53 | ||
| 10 | 32 | 37 | 41 | 45 | 48 | 51 | 54 | 56 | |
| 12.5 | 36 | 41 | 45 | 49 | 52 | 55 | 58 | 60 | |
| 15 | 40 | 45 | 49 | 53 | 56 | 59 | 61 | 63 | |
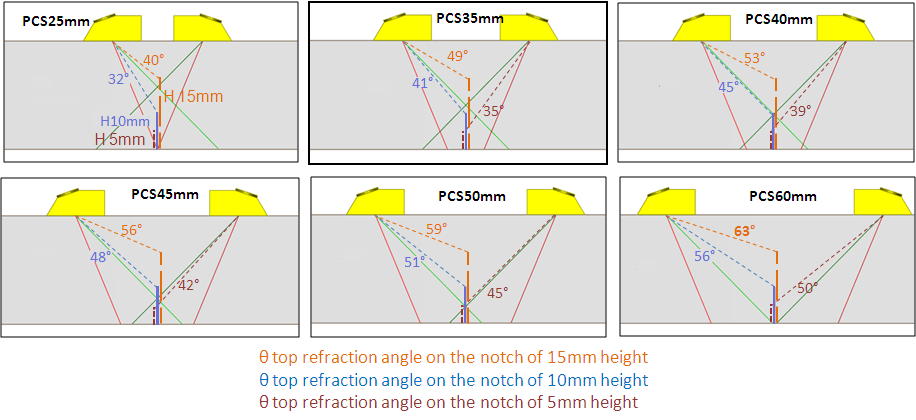
The minimum refraction angle is 32° (25 mm PCS, 10 mm notch) and the maximum refraction angle is 63° (60 mm PCS, 15 mm notch).
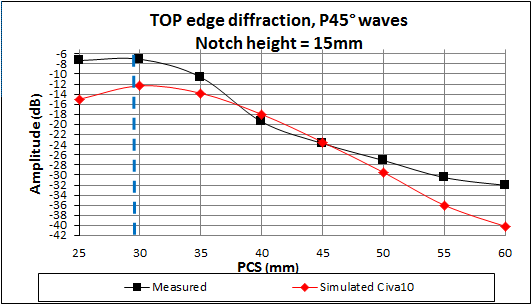
Maximum amplitudes on top edges of notches in P45 mode
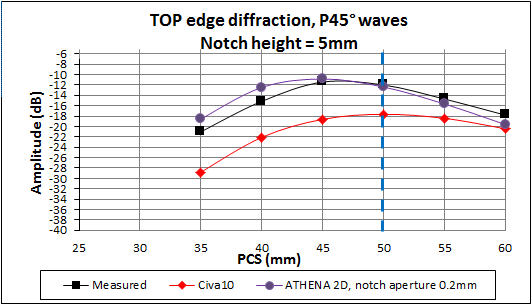
Top edge diffraction echoes amplitudes are displayed hereafter for different notch heights and PCS from 25 to 60 mm. The experimental results are compared to simulations performed with CIVA 10. The results are calibrated versus the Ø2 mm SDH at 20 mm depth inspected with a 40 mm PCS.
The blue dotted line indicates the PCS for which the P-axes crossing point matches the top edge of the notch.
 ;
; 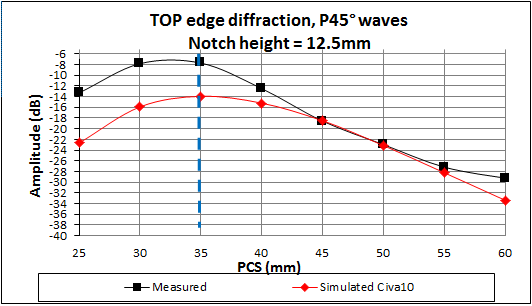
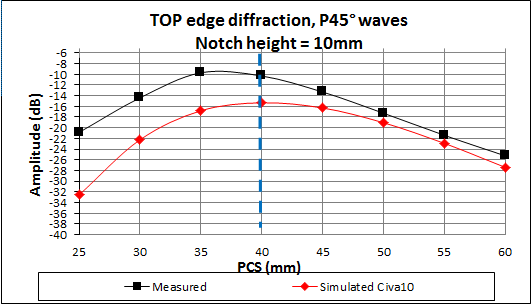
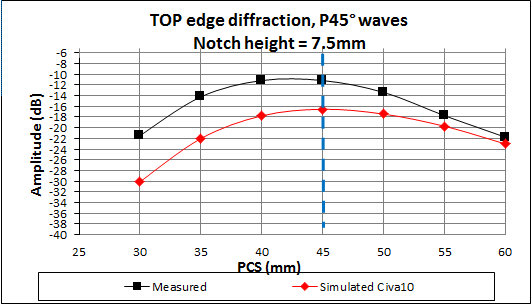
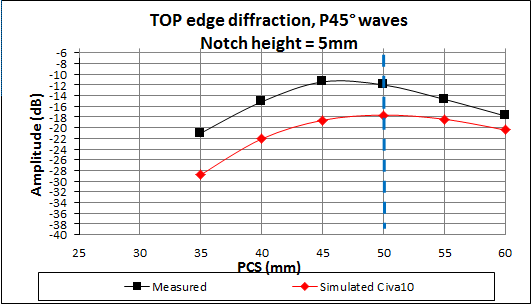
The discrepancies between experimental and CIVA 10 simulated amplitudes are displayed in the next table:
| Experiment / Simulation discrepancies (dB) | PCS (mm) | ||||||||
| 25 | 30 | 35 | 40 | 45 | 50 | 55 | 60 | ||
| Notch height (mm) | 5 | -7.8 | -6.9 | -7.2 | -5.6 | -3.7 | -2.6 | ||
| 7.5 | -8.6 | -7.8 | -6.6 | -5.4 | -4.1 | -2.0 | -1.3 | ||
| 10 | -11.7 | -7.8 | -7.1 | -5.0 | -3.0 | -1.8 | -1.5 | -2.2 | |
| 12.5 | -9.4 | -8.1 | -6.2 | -2.7 | 0.1 | -0.2 | -1.1 | -4.1 | |
| 15 | -7.7 | -5.3 | -3.2 | 1.5 | 0.3 | -2.4 | -5.5 | -7.8 | |
Contrary to the previous P60 case, the comparison of simulated and experimental results show strong discrepancies for small PCS and also when the P-axes crossing point is at the depth of the top edge. For small PCS, the measured discrepancies are generally around 6 dB and up to 11 dB, the response is under-estimated for all notch heights. The higher is the PCS, the weaker are the discrepancies, particularly for high notches. The reasons of these discrepancies will be discussed later.
Ascans and phase on the top edge of notches in P45 mode
Experimental (black) and simulated (red) Ascans obtained for top edge echoes on notches of different heights are displayed for 3 PCS (25, 40 and 50 mm) after amplitude normalization.
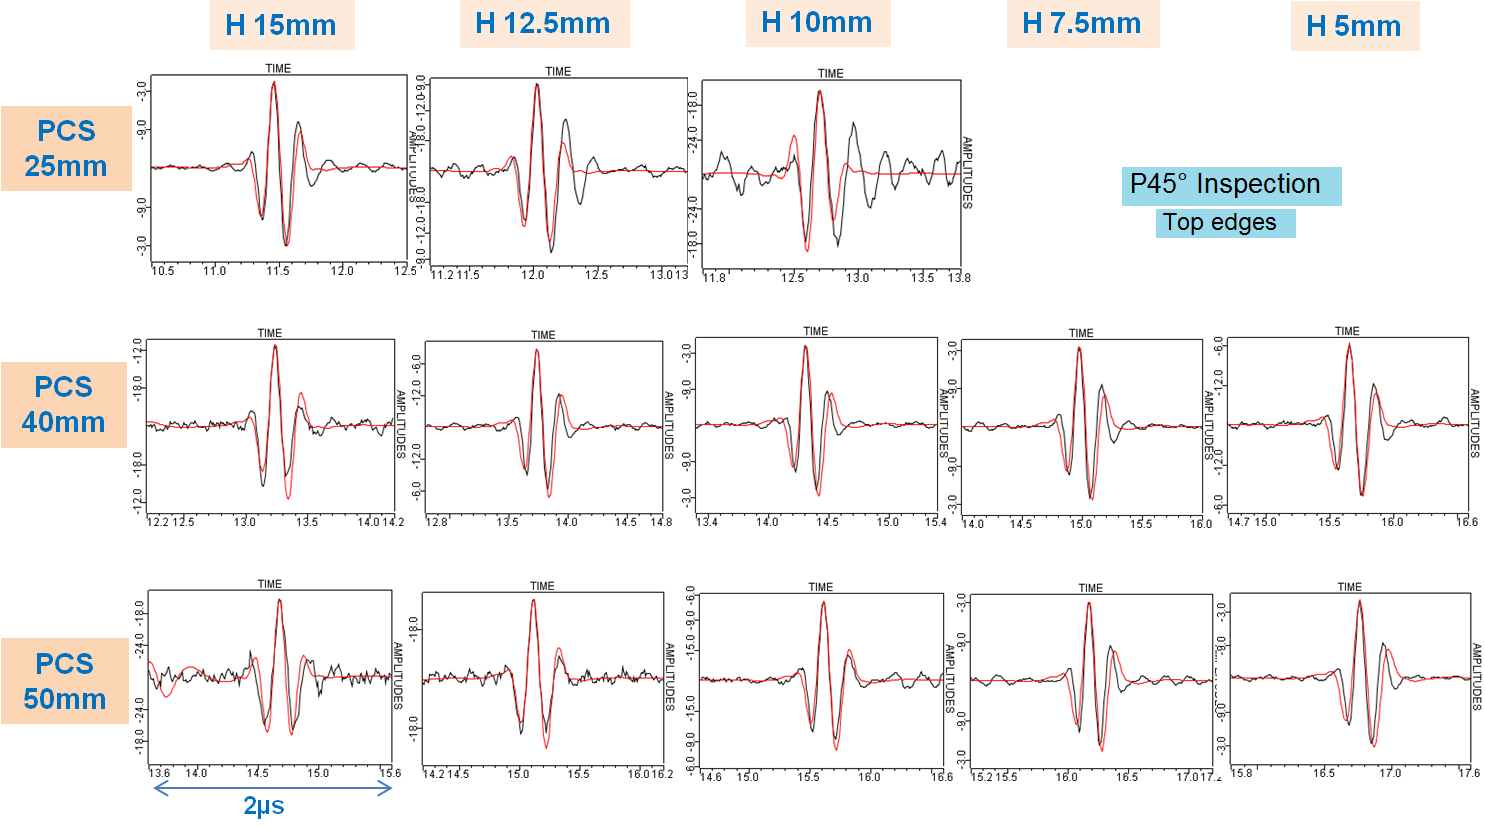
Simulated Ascans are close to experimental Ascans, except for the 10 mm notch and the 25 mm PCS. In this case the experimental A-scan is longer, which means with a smaller bandwidth, than the simulated Ascan. For each PCS, the simulated Ascan from the 10 mm notch shows a phase shift compared to those from the 15 and 12.5 mm notches. This phase shift also appears in experimental Ascans but is weaker. Moreover, the simulated echo is slightly too “low frequency” for 50 mm PCS with 7.5 and 5 mm notches.
Results on top edge of notches in P70 mode
The TOFD inspection has been performed on the 15 mm backwall breaking notch of the specimen containing various notches. The PCS varies from 35 mm to 120 mm. The gap between the P-axes crossing depth and the top edge of the notch is given in the following table versus the PCS:
| Gap to the crossing depth (mm) | PCS (mm) | |||||||||||||||
| 40 | 45 | 50 | 55 | 60 | 65 | 70 | 75 | 80 | 85 | 90 | 95 | 100 | 105 | 110 | 120 | |
| Notch height: 15 mm | 7.7 | 6.8 | 5.9 | 5.0 | 4.1 | 3.1 | 2.2 | 1.3 | 0.4 | -0.5 | -1.4 | -2.3 | -3.2 | -4.1 | -5.1 | -6.9 |
Moreover, the refraction angles on the top edge are given versus the PCS and the notch height:
| Refraction angle (dB) | PCS (mm) | ||||||||||||||||
| 35 | 40 | 45 | 50 | 55 | 60 | 65 | 70 | 75 | 80 | 85 | 90 | 90 | 100 | 105 | 110 | 120 | |
| Notch height: 15 mm | 49 | 53 | 56 | 59 | 61 | 63 | 65 | 67 | 68 | 69 | 71 | 72 | 72 | 73 | 74 | 75 | 76 |
The minimum refraction angle is 49° (35 mm PCS) and the maximum refraction angle is 76° (120 mm PCS).
Maximum amplitudes on top edges of notches in P70 mode
Top edge diffraction echoes amplitudes are displayed hereafter for PCS from 35 to 120 mm. The experimental results are compared to simulations performed with CIVA 10. The results are calibrated versus the Ø0.7 mm SDH at 10 mm depth inspected with a 55 mm PCS.
The blue dotted line indicates the PCS for which the P-axes crossing depth matches the top edge of the notch.
| PCS (mm) | 40 | 45 | 50 | 55 | 60 | 65 | 70 | 75 | 80 | 85 | 90 | 95 | 100 | 105 | 110 | 115 | 120 |
| Experiment / Simulation discrepancies | -1.6 | -1.1 | 1.0 | 1.3 | 1.3 | 1.6 | 1.2 | 1.1 | 0.8 | 0.8 | 0.6 | 0.5 | 0.3 | 0.7 | 0.7 | 0.6 | 0.4 |
These amplitudes show a good agreement (discrepancies lower than 2 dB).
Conclusion
The goal of this study was to validate CIVA predictions for contact TOFD inspections. Different configurations were studied in order to validate vertical notches diffraction echoes.
For the notches, the times of flight for both top and bottom edges are correctly predicted. It is not always the case for amplitudes predictions even if a very good agreement is noticed for most of the studied cases. Some discrepancies appear for some cases when comparing experimental and CIVA simulated amplitudes. The most important differences (for amplitude and temporal waveform) were reported for P45 inspections when PCS is very small or very high.
Among possible origins explaining those discrepancies, two parameters were studied. Comparisons of experimental P45 TOFD inspections with the ones simulated with another simulation module CIVA-ATHENA2D allowed the influence of these parameters to be confirmed:
- The notch aperture
- The 2D GTD modeling
However these two parameters do not explain all the discrepancies, and some complementary studies are still in progress to complete this analysis.
Notch aperture
CIVA does not take into account notch aperture. Therefore, a module coupling CIVA with the Finite Element code CIVA-ATHENA2D was used in order to consider this parameter. Then, the simulations are computed in the inspection plane.
Studies have demonstrated that the he top and bottom diffraction echoes may be influenced by the notch aperture. The diffraction echoes amplitude increases with the aperture for some incidence angles. This increase is caused by the contribution of a specular echo on the top edge and by the contribution of a creeping wave on the bottom edge.
The effect of the notch aperture has been taken into account in CIVA-ATHENA2D calculations for P60 at 5 MHz and 7.5 MHz and P45 at 5 MHz and with a notch aperture of 0.2 mm. The amplitudes obtained with CIVA-ATHENA2D are compared with the experimental ones and the ones generated with CIVA. The following figures show that, when considering the notch aperture, the amplitudes predicted by CIVA-ATHENA2D are similar to the ones measured experimentally.
Regarding the results obtained with CIVA, points to remember are:
- When using PCS for which we already had a good agreement between CIVA and experience, taking into account the notch aperture does not change the top edge diffraction echo.
- For small PCS for which we observed discrepancies between CIVA and experience, taking into account the notch aperture changes the top edge diffraction echo. Its amplitude increases compared to the one obtained with a null aperture notch and gets close to the one measured experimentally.
- For large PCS for which we observed discrepancies between CIVA and experience, taking into account the notch aperture does not change the top edge diffraction echo.
The analysis of the differences observed for bottom edge diffraction echoes leads to the same conclusion.
2D GTD modeling
In CIVA10, an approximation is made on the GTD diffraction coefficients used when calculating notch edge diffraction echoes. These coefficients are “2D”, i.e. they are defined for incident rays arriving on the edge and contained in a plane (P) normal to this edge. These incident rays generate diffracted rays that are also in the plane P. The incident rays that are not contained in this plane are projected onto it in order to be able to use these “2D” coefficients. In the previous studied cases, the notches edges are parallel to the surface specimen, the “3D” effects are then only due to the probe divergence in the plane perpendicular to the incidence plane. Evaluations have been performed accounting for 3D GTD coefficients, which allow improving results in some cases.
Thus the CIVA 11 release integrates those 3D GTD coefficients rather than 2D ones.
Continue to Results on backwall echoes
Back to TOFD