
Inclusion in water – phased-array – Experimental set-up
Summary
Probes AND REFLECTORS USED
A linear phased-array of 64 elements, 5 MHz, was used for the measurements. Its dimensional characteristics are as follows:
- Width of an element: 0.5mm
- Elevation of an element: 10mm
- Pitch : 0.6mm
- Total aperture : 38.3 x 10 mm²
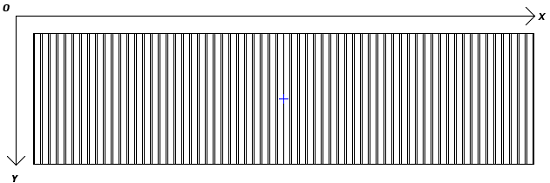
Figure 1 : Linear phased-array, 64 elements, 38.3x10mm², 5MHz.
Reflectors used:
- one inclusion in stainless steel of 1 mm diameter
- and an “infinite plane” (flat surface large compared to the ultrasound beam).
MEASURES realised
Mappings in the X and Y planes were acquired for the inclusion of 1mm diameter (the convention adopted for the axes is described Figure 2). A profile according Z was acquired for the infinite plane.
Configurations with and without delay laws were evaluated:
- Without delay laws: a sequencing of 20, 16, 12, 8, 4 and 1 element has been configured
- With delay laws: several active apertures were evaluated (20, 32, 48 and 64 elements). A delay law has been set for focusing in L0 ° at 33mm depth in water.
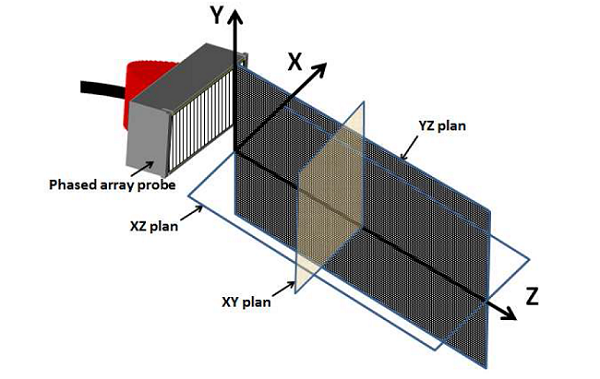
Figure 2 : Axis maps
Maps in the XZ and YZ planes and profil along Z
An example of the experimental C-scan maps in the XZ and YZ planes obtained on the inclusion of 1 mm diameter is presented on Figure 3. This is a configuration where 32 elements of the phased array probe are active and a delay law for focusing at 33mm in the water is configured. A superposition of the echodynamic curves extracted at the centers of the two C-scans is displayed below the maps.
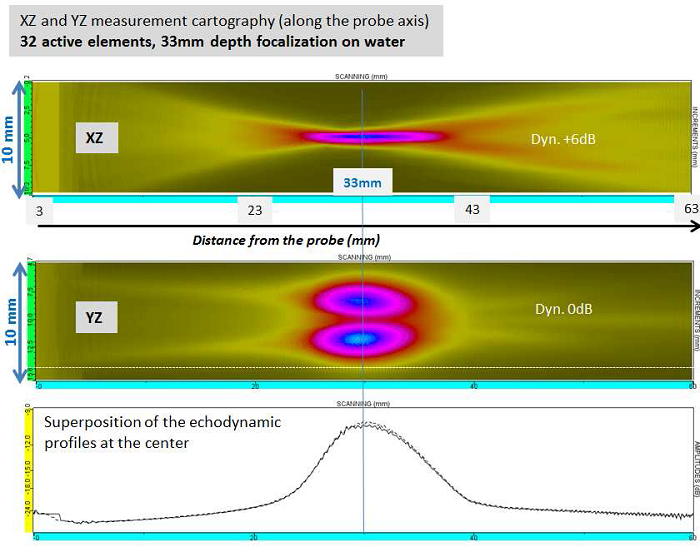
Figure 3 : Examples of experimental mapping XZ and YZ, case of a focusing at 33mm depth in water, operture of 32 elements.
For the configurations without delay law, sequencing of the probe has been set so as to compare the amplitude / distance curves on elements taken from different places on the phased-array. An example of a superposition of axial profiles in the case of seven sequences of four active elements is shown Figure 4. The overlay shows good reproducibility between each sequence with a difference of sensitivity of the order of 2dB.
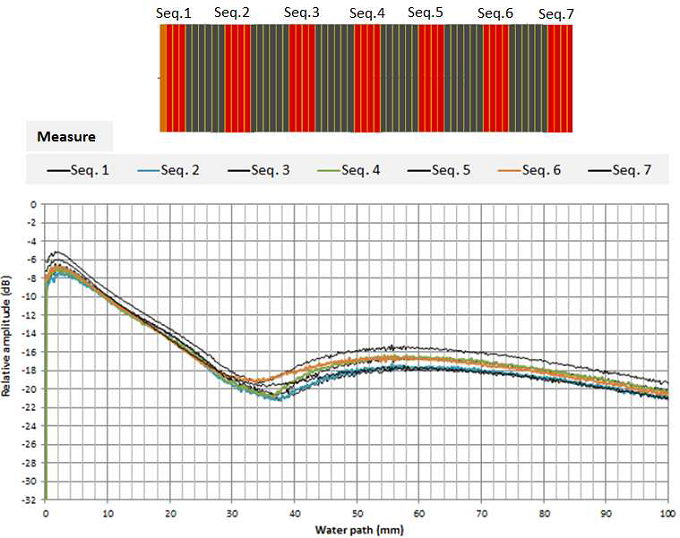
Figure 4 : Superposition of axial profiles measured on the ball of 1mm diameter , example of 7 sequences of 4 active elements.
MAPs in the XY plane
Experimental mapping in the XY plane were acquired for the inclusion of 1mm diameter. Examples of experimental maps produced at distances of 18, 33, 63 and 103 mm are shown in Figure 5. For better visualization of the mapping, dynamic was changed. The maps are therefore not directly comparable. This is a configuration where 32 elements of the phased array probe are active and a delay law for focusing at 33mm depth in water is set.
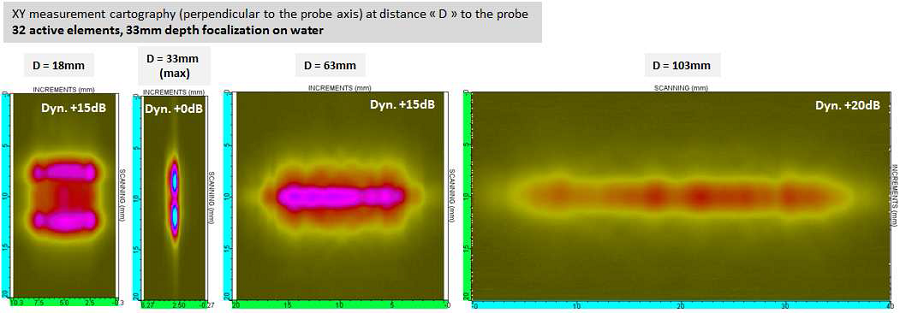
Figure 5 : Examples of experimental XY mapping, case of a focusing at a 33mm depth in water, operture of 32 elements.
As an illustration, the images below refer to the beam computation performed at the same positions (image dynamic in the different images are changed, the images are not directly comparable to experimental mapping of the previous figure). These images show the different trends of the ultrasonic field in both directions (the cutting plane and the perpendicular plane). In the direction of the probe cutting (horizontal axis), the focus applied by the delay law at 33 mm leads to a very large variation in distribution of the ultrasonic energy as a function of depth. Along the vertical axis (direction of the elevation of the elements), the shape of the field poorly varies given the low beam divergence in this plane.
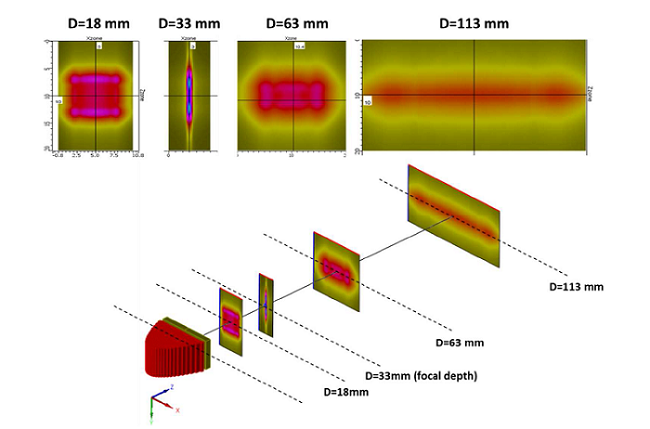
Figure 6 : Examples of simulated maps at different depths for a focus at 33 mm depth in water.
Quantitative comparisons between measured and simulated data fields are reported in the following.
Adjustment of the probe orientation
A significant accuracy is required when adjusting the orientation of the transducer in order to ensure the perpendicularity of the beam axis relatively to the XY plane formed by the probe displacement axes (precision of the order of 0.1 °).
The experimental setup is shown in Figure 7.
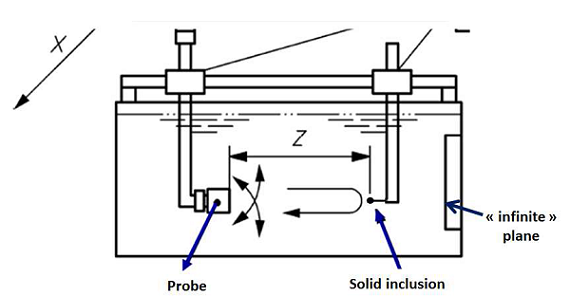
Figure 7 : Set-up for measuring the characteristics of the ultrasonic field radiated by an immersion probe in pulse echo mode
The experimental procedure adopted for the adjustment of the orientation of the phased-array is described below.
For reliable control, it is necessary that the measured echo is located in the far field of the probe. For that, an active aperure of 20 elements without applying delays law has been chosen. In this case, the dimensions of the active aperture are almost identical in the two planes of the probe and thus the near field limit in both planes is almost identical.
The procedure to set the exact orientation of the probe consists in a systematic verification of the symmetry of the echo of the inclusion in the X and Y axis (Figure 8). The orientation correction is provided by a goniometer disposed on the support of the probe.
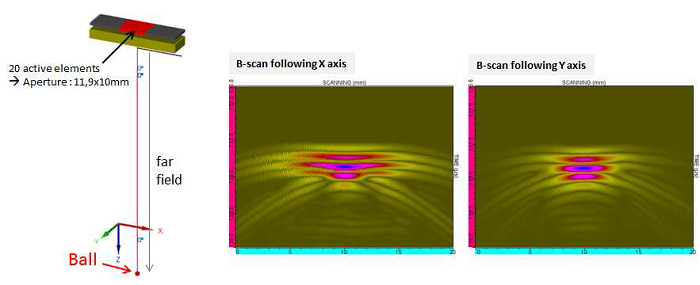
Figure 8 : Adjustment of the orientation of the probe relative to the mechanical axes of movement.
REPRODUCIBILITY AND EXPERIMENTAL UNCERTAINTY
The experimental uncertainty associated with mechanical adjustments was evaluated by disassembly and reassembly of complete device: it is 1dB. The confidence interval of the experimental data has been estimated at +/- 2 dB (1dB linked to uncertainty for the studied reflector and 1 dB related to the reference reflector for the amplitudes). An example of experimental reproducibility is presented in Figure 9. This is a superposition of amplitude / distance profiles of an echo of a solid inclusion of 1mm in water. The maximum difference is 1 dB.
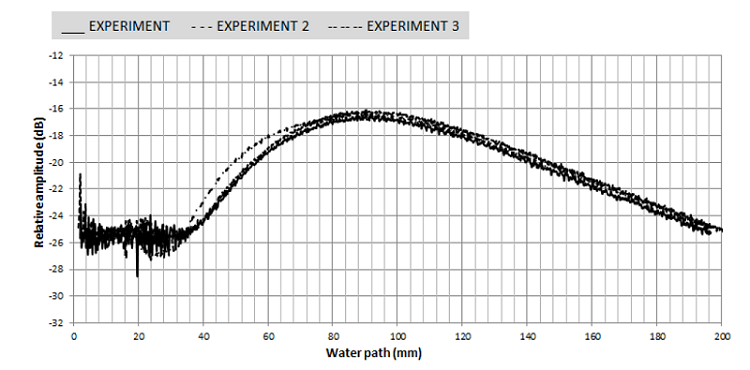
Figure 9 : Example of experimental reproducibility
Continue to Simulation settings
Back to summary